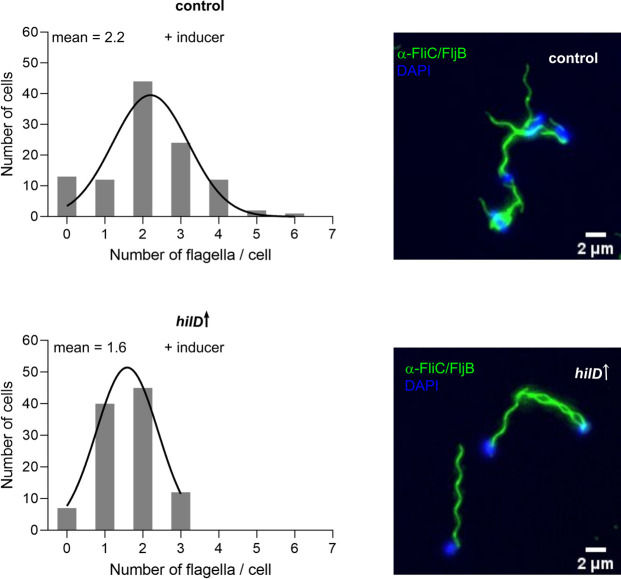
Fig 5. HilD induction does not affect flagellation.
Counts of flagella per cell were determined using fluorescence microscopy. Histograms of counted flagella per cell are shown to the left. Average flagella numbers were calculated by Gaussian non-linear regression analysis (black line). The plotted data represent at least 100 single cells from one representative experiment. Representative microscopy images of flagella immunostaining are shown to the right. Scale bar is 2 μm. Strains analysed were TH437 (control) and TH17114 (hilD↑). hilD↑: strain expressing hilD under an inducible promoter.

