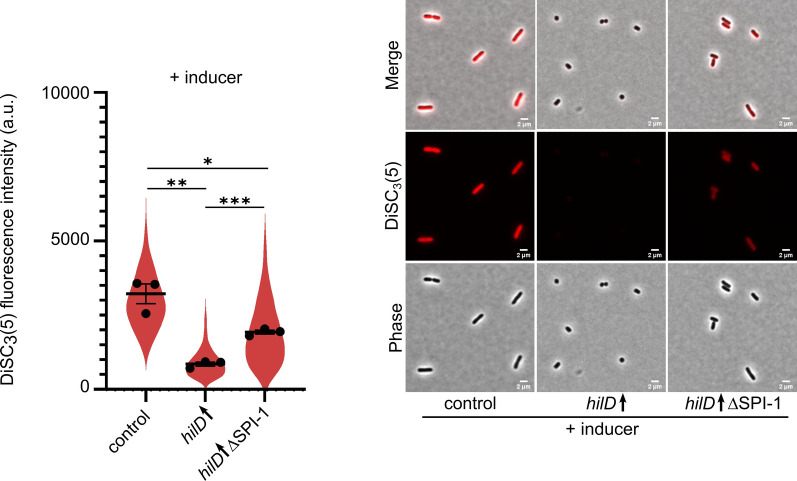
Fig 6. HilD induction results in membrane depolarization.
Strains were grown under HilD-inducing conditions using AnTc followed by staining with the membrane potential sensitive dye DiSC3(5). DiSC3(5) fluorescence intensities of single cells were quantified (left). Individual data points represent the averages of the single-cell data of independent experiments. Violin plots represent data values from at least 400 analysed single cells. Horizontal bars (bold) represent the mean of the calculated average of three independent experiments. The error bars represent the standard error of mean and statistical significances were determined using a two-tailed Student’s t-test. The error bars represent the standard error of the mean and statistical significances were determined using a two-tailed Student’s t-test (***, P < 0.001; **, P < 0.01; *, P < 0.05). Representative microscopy images are shown (right). Scale bar is 2 μm. Strains analysed were TH437 (control), TH17114 (hilD↑), EM12479 (hilD↑ ΔSPI-1), hilD↑: strain expressing hilD under an inducible promoter. AnTc: anhydrotetracycline. a.u.: arbitrary units.

