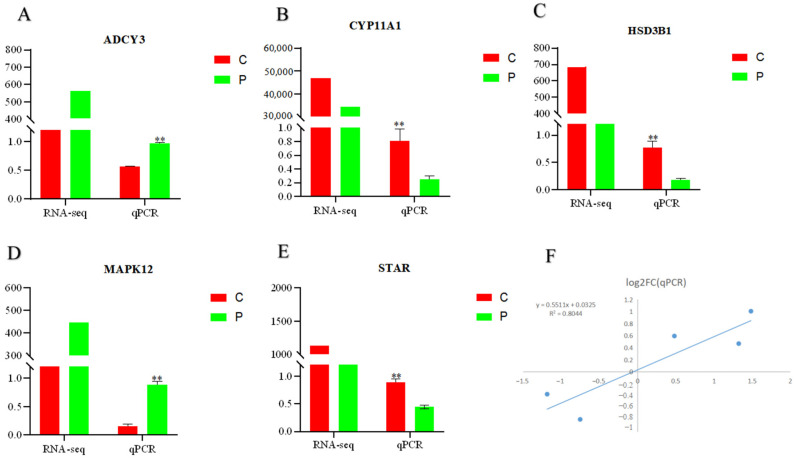
Figure 5.
qPCR validation of RNA-Seq. (A–E): Five coding genes; (F): Correlation analysis between qPCR and RNA-Seq results. The Y-axis indicates the log2FC value according to qPCR and the X-axis indicates the log2FC value according to RNA-Seq. “**” indicate p < 0.01. (C): Control group (0 ng/mL PRL); P: GCs treated with 500 ng/mL PRL (GCs with HPCs).

