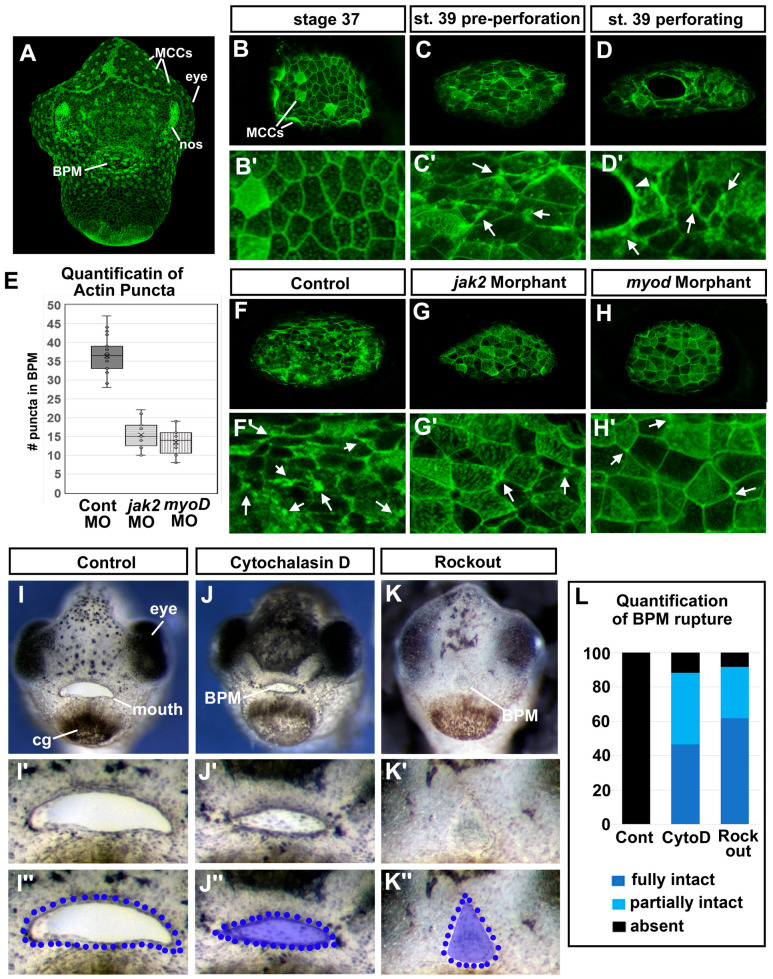
Figure 6.
Actin dynamics and buccopharyngeal perforation. (A–G) Actin dynamics revealed by phalloidin labeling during buccopharyngeal membrane perforation. (A) Shows a frontal view of the face at stage 39 (representative from 30 embryos in 4 biological replicates). (B) The buccopharyngeal membrane at stage 37 when the mouth shape is round. (C) The buccopharyngeal membrane at stage 39 just prior to perforation. Note the puncta spots and accumulation of F-actin (white arrows). (D) The buccopharyngeal membrane during perforation shows accumulation of F-actin surrounding the holes. (E–H’) The buccopharyngeal membranes of control morphants (F), jak2 morphants (G), and myod morphants (H). (I–K’’) Images of representative embryos after treatment with cytochalasin D (1 μM) and Rockout (100 μM) from stages 37–40. Quantification of buccopharyngeal membrane rupture in embryos exposed to actin inhibitors shown in (L) (n = 60, 3 biological replicates).

