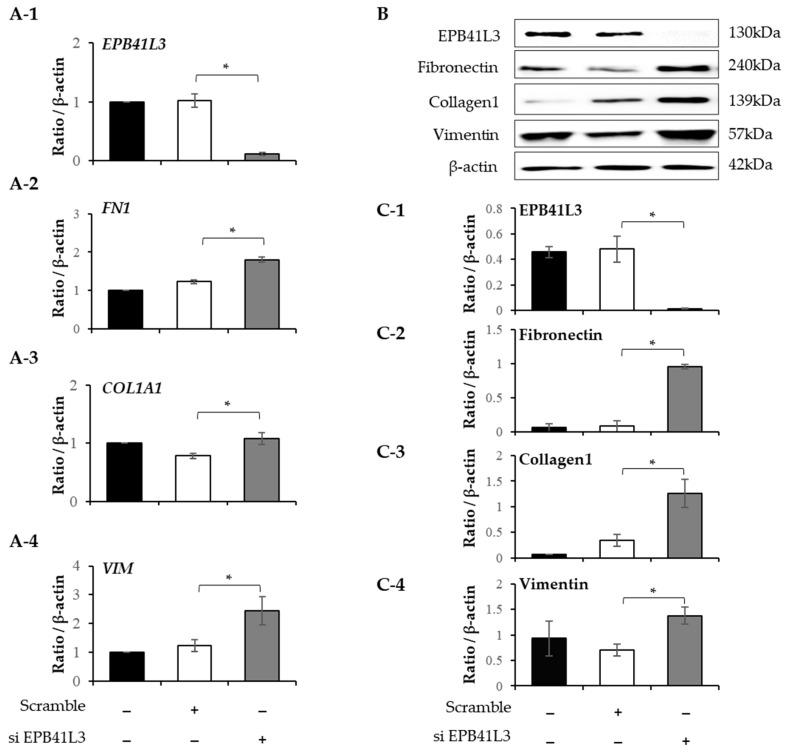
Figure 7.
Effect of silencing EPB41L3 on FMT-related genes in MRC5 cells. Changes in the expression of EPB41L3 and FMT-related genes in response to EPB41L3 siRNA. Expression of mRNA and protein were measured using (A-1–A-4) real-time PCR, (B) Western blot, and (C-1–C-4) densitometry of protein bands. Independent experiments were analyzed using densitometry. They were normalized to β-actin and expressed as ratios. All experiments separately were performed six times, and the representative images are shown. Data are mean ± SE of 6 independent experiments. Significant differences between groups were evaluated using two-way ANOVA with Bonferroni multiple comparisons test. * p < 0.05. Black bar: control group, open bar: scramble group, gray bar: EPB41L3-knockdown group. (See Figure S7 for original Western blot images).

