Figure 3.
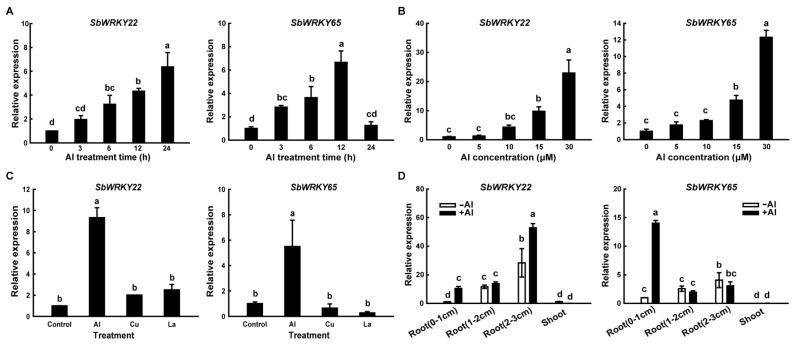
Quantitative real-time PCR analysis of SbWRKY22 and SbWRKY65 expression profiles. (A) Relative expression of SbWRKY22 and SbWRKY65 in sweet sorghum root apices (0–1 cm) in response to 15 μM Al stress with different treatment times. (B) Relative expression of SbWRKY22 and SbWRKY65 in root apices exposed to different Al concentrations for 12 h. (C) Relative expression of SbWRKY22 and SbWRKY65 in root apices in response to AlCl3 (15 μM), CuCl2 (0.5 μM) and LaCl3 (10 μM) for 12 h. (D) Relative expression of SbWRKY22 and SbWRKY65 in root apices (0–1 cm), roots (1–2 cm), roots (2–3 cm), and shoot sections in the absence (−Al) or presence (+Al, 15 μM) of Al treatment for 12 h. Data represent the means ± SD from three independent biological replicates. Columns with different letters are significantly different according to Tukey’s test (p < 0.05).

