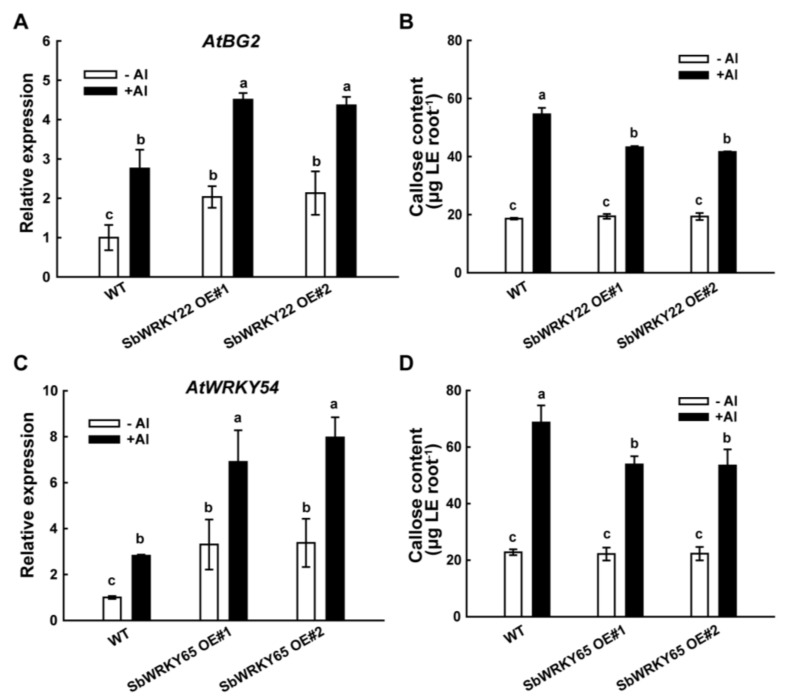
Figure 9.
Overexpression lines of SbWRKY22/SbWRKY65 show enhanced AtBG2/AtWRKY54 expression and reduced callose accumulation. (A,C) Quantitative real-time PCR analysis of the expression of AtBG2/AtWRKY54 in WT (Col-0) and two independent SbWRKY22/SbWRKY65 overexpression lines. Seven-day-old seedlings were pre-cultured on a solid MS medium vertically and then transferred to a liquid medium containing 0.5 mM CaCl2 at pH 5.0 without AlCl3 or with 15 μM AlCl3 for 6 h. (B,D) Callose content in the roots of WT (Col-0) and two independent SbWRKY22/SbWRKY65 overexpression lines without or with 15 μM AlCl3 for 6 h. Data represent the means ± SD for three independent biological replicates. Columns with different letters are significantly different according to Tukey’s test (p < 0.05).

