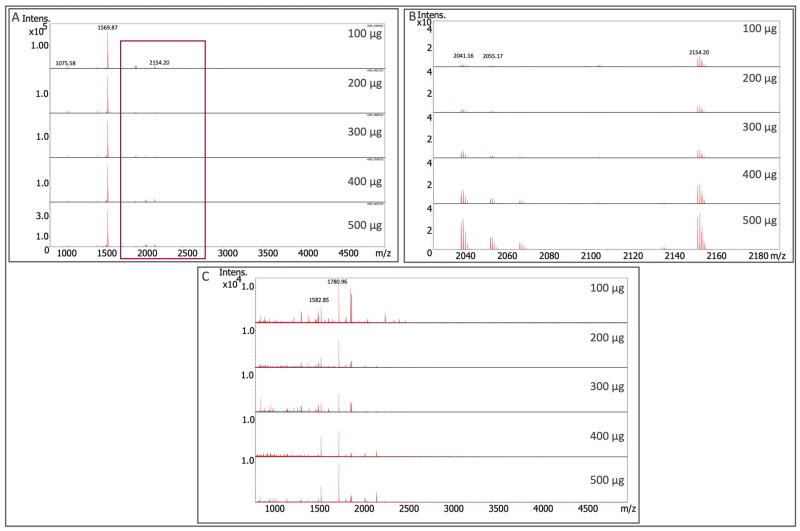
Figure 6.
MALDI mass spectra of signals recovered from varying LysC digested soluble protein input materials utilizing the histone H3 (Panel A and B) and histone H4 (Panel C) Affi-BAMS beads from HCT116, COLO 205, and MOLP-8 nuclei lysates. Although Panel A shows 1569.87 m/z as the most intense histone PTM analyte, Panel B highlights the lower intensity analytes from the same spectra files attributed to several other histone peptides co-captured via enrichment.

