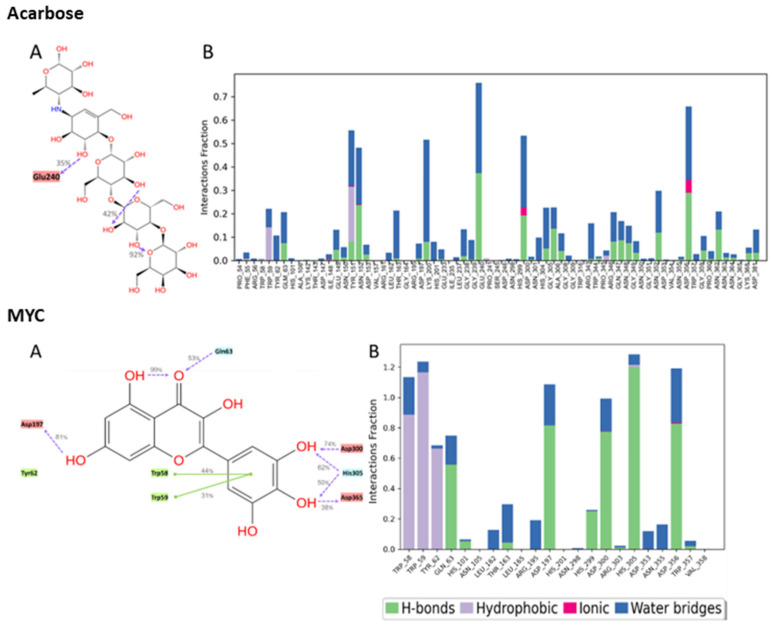
Figure 8.
Interactions between acarbose and the native inhibitor MYC and pancreatic alpha-amylase (PDB ID: 4GQR) residues. Panel (A) depicts a detailed schematic representation of the interactions, where blue and green depict the polar and hydrophobic residues, respectively. Panel (B) displays a normalized stacked bar chart that represents the interaction between the receptor binding site residues and the compounds throughout the simulation.

