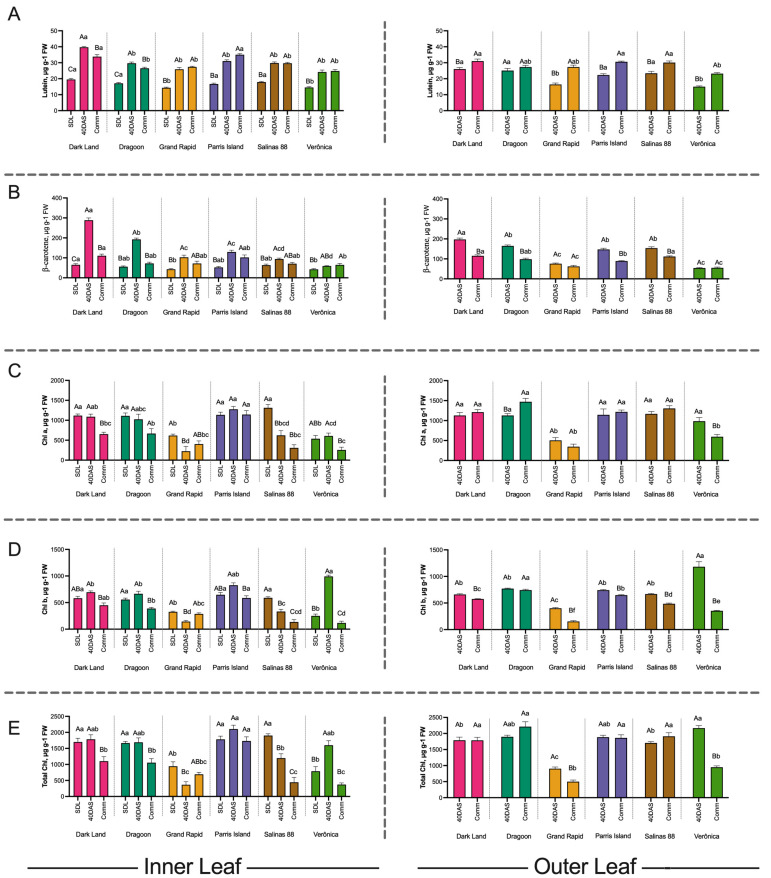
Figure 2.
Analysis of chlorophyll and carotenoids in the inner and outer leaves of six lettuce cultivars. (A) lutein, (B) β-carotene, (C) Chla, (D) Chlb and (E) total chlorophyll content in the inner and outer leaves of six lettuce cultivars at seedling stage (SDL, 20 Days after sowing (Das)), 40 DAS and at commercial size (60 DAS). Error bars are standard deviation of the mean from three biological replicates, each being the pooled sample of at least three technical replicates, at p = 0.05 level. Bars with similar capital letters for each cultivar in each leaf position at different time points are not significantly different (p ≥ 0.05), using one-way ANOVA analysis followed by Tukey pos hoc test. Bars with similar small letters at the same time point in each leaf position between cultivars are not significantly different (p ≥ 0.05), using one-way ANOVA analysis followed by Tukey pos hoc test.

