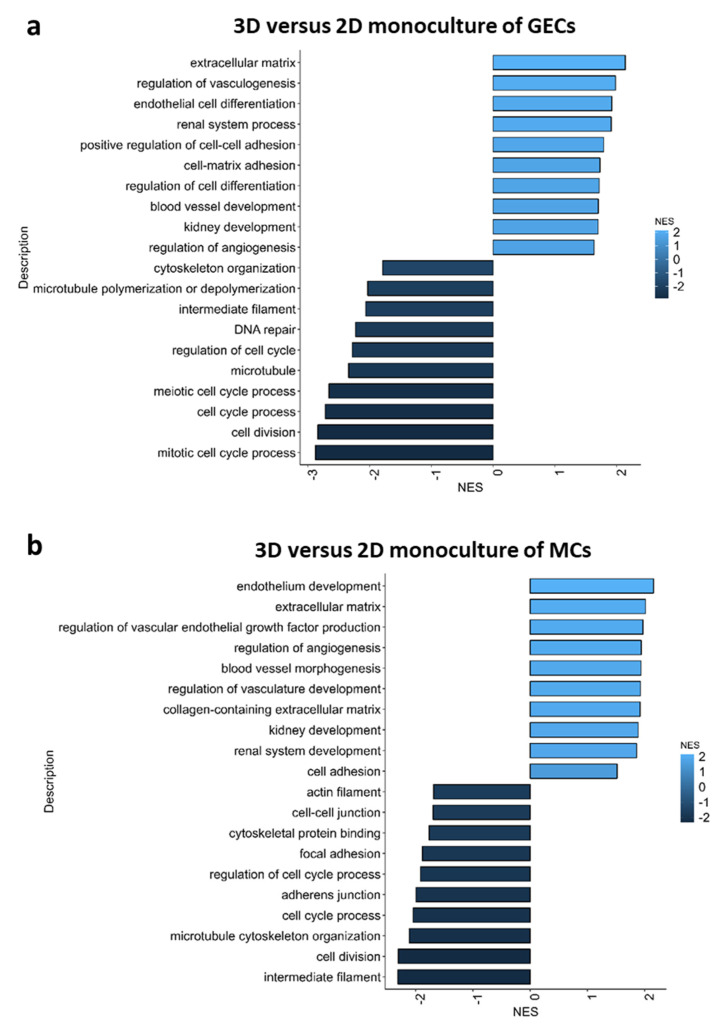
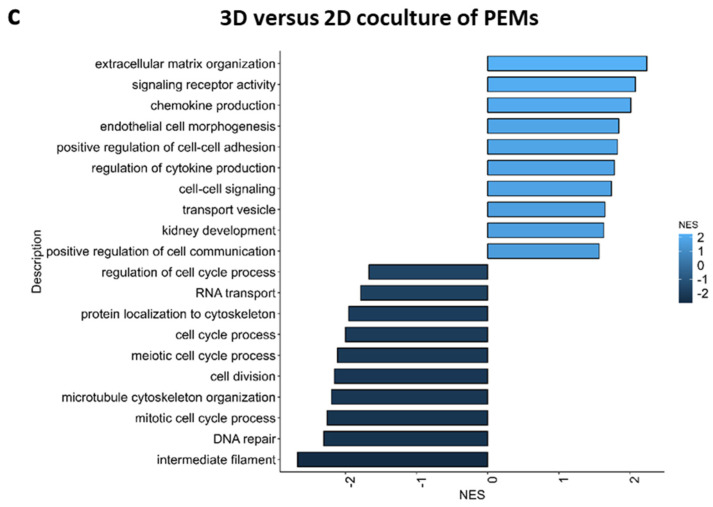
Figure 6.
Pathway analysis of bulk-RNA sequencing data from 2D and 3D glomerular cultures. Pathways analysis was performed for monoculture of glomerular endothelial cells (GEC) (a), monoculture of mesangial cells (MC) (b) and co-culture of podocytes, GECs and MCs (c) in 3D or rather 2D. Pathways that were more active in 3D cultures and less active in 2D cultures are colored in light blue. In contrast, pathways that were more active in 2D cultures and less active in 3D cultures were colored in dark blue.


