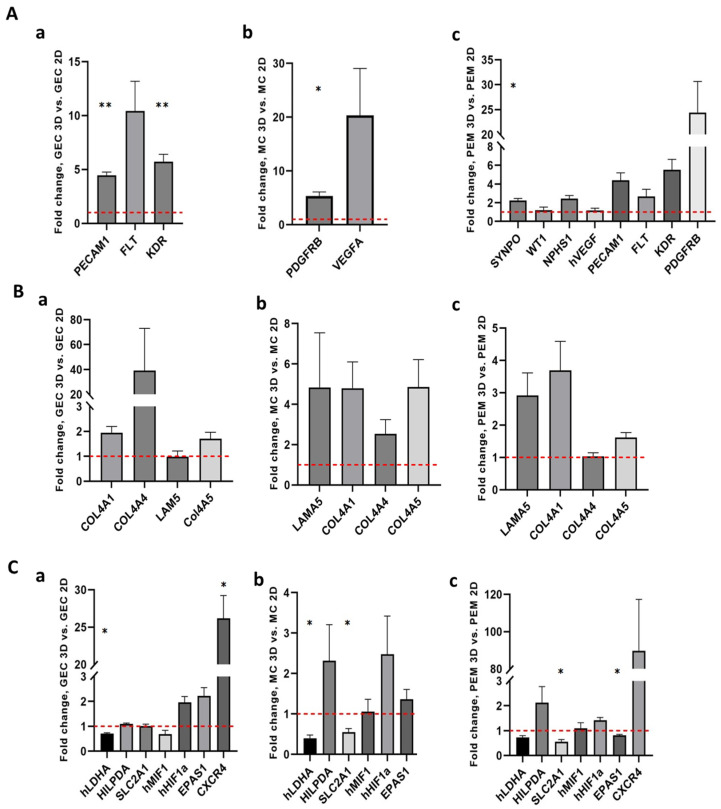
Figure 7.
qPCR for cell type-specific markers, extracellular matrix and cellular response to hypoxia of 2D and 3D glomerular cultures. (A) qPCR for cell type-specific maker expression and cellular signaling: (a) comparison of glomerular endothelial cell (GEC) markers in 3D versus 2D monoculture of GECs; (b) Comparison of mRNA expression of mesangial cell (MC) markers in 3D versus 2D monoculture of MCs; (c) comparison of mRNA expression of podocyte, MC markers and GEC markers in 3D versus 2D glomerular co-cultures of podocytes, GECs and MCs (PEM). (B) qPCR for expression of extracellular matrix: (a) comparison of 3D versus 2D monoculture of GECs; (b) comparison of mRNA expression of extracellular matrix in 3D versus 2D monoculture of MCs; (c) comparison of mRNA expression of extracellular matrix in 3D versus 2D glomerular co-cultures. (C) qPCR for expression of hypoxia-related genes: (a) comparison between 3D and 2D monoculture of a: GECs and (b) mesangial cells; and (c) comparison of 3D versus 2D glomerular co-cultures. n = 3 for each experiment. Data are given as mean ± SEM, * p < 0.05, ** p < 0.01.

