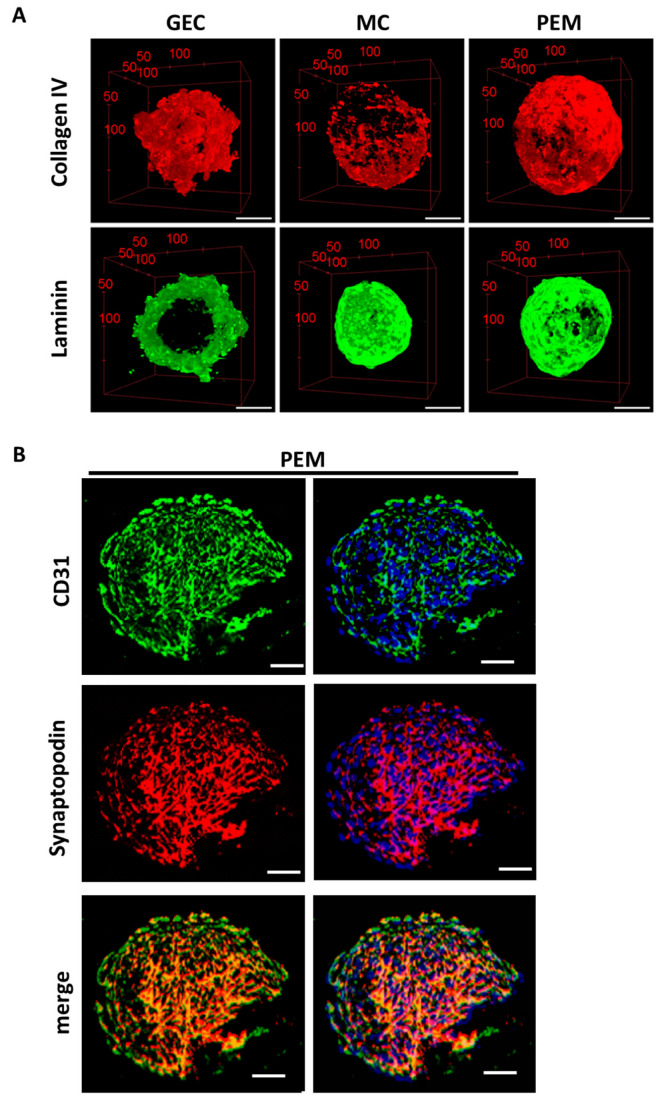
Figure 8.
Immunofluorescence staining showing the production of extracellular matrix and the localization of podocyte-specific and glomerular endothelial cell-specific marker proteins in 3D glomerular co-cultures. (A) 3D reconstructions of multiphoton microscopy image-stacks of glomerular spheroids showing collagen IV (red) and laminin (green) expression in glomerular endothelial cell (GEC) monoculture spheroids, mesangial cell (MC) monoculture spheroids and glomerular co-culture (PEM). Scale bar represents 50 µm. (B) Confocal microscopy images of glomerular co-culture spheroids (PEM) demonstrating CD31 (green), synaptopodin (red) and merged images. Nuclear staining is shown in blue. Scale bar represents 50 µm.

