Figure 1.
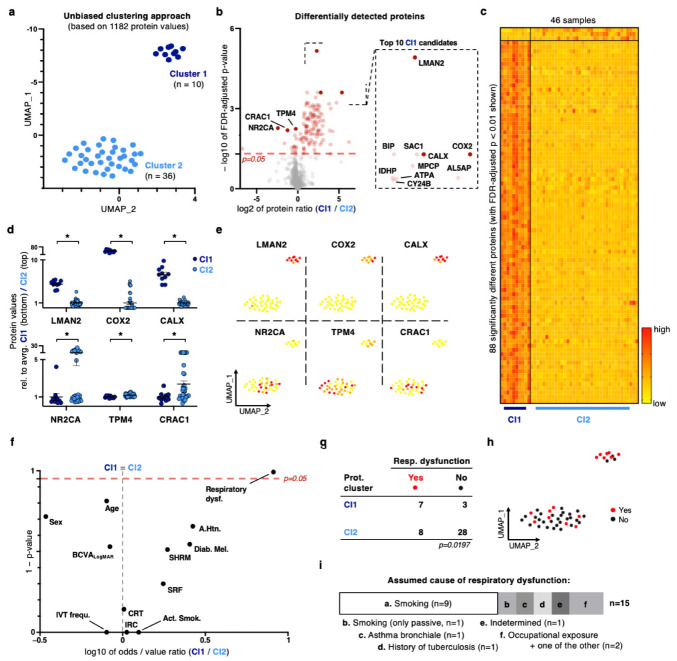
Dimensionality reduction and unbiased clustering based on proteomic profiles reveal a strong signature for oxidative stress response with respiratory dysfunction as an underlying clinical condition. (a) UMAP plot based on 46 whole-blood proteome samples. Each dot represents one sample of one subject. Color-coding: unbiased clustering based on nearest-neighbor approach with two distinct subclusters. (b) Left: Volcano plot for visualization of differentially detected proteins between the two cohorts. Right: Highlight of the top 10 candidates. (c) Heatmap visualization. Each column represents one blood sample of one donor; each row represents one distinct protein. Only proteins with significant difference (FDR-adjusted p-value < 0.01) between clusters are shown. Color-coding reflects normalized protein detection level per individual sample: red represents highest, bright yellow lowest value. A color-coded scale is located at the bottom right. (d) Protein values of top three detected proteins per cluster compared to average of contrary cluster. (e) Feature plot of proteins shown in (c). Color-coding: compare (c). (f) Volcano plot of meta-data annotations between the two clusters. (g) Contingency table of the two dichotomic features proteome cluster and respiratory dysfunction. (h) Feature plot for respiratory dysfunction. (i) Frequency of assumed causes for respiratory dysfunction. For all graphs in this figure (if not specified otherwise): * p < 0.05, Mann–Whitney U test, FDR correction.

