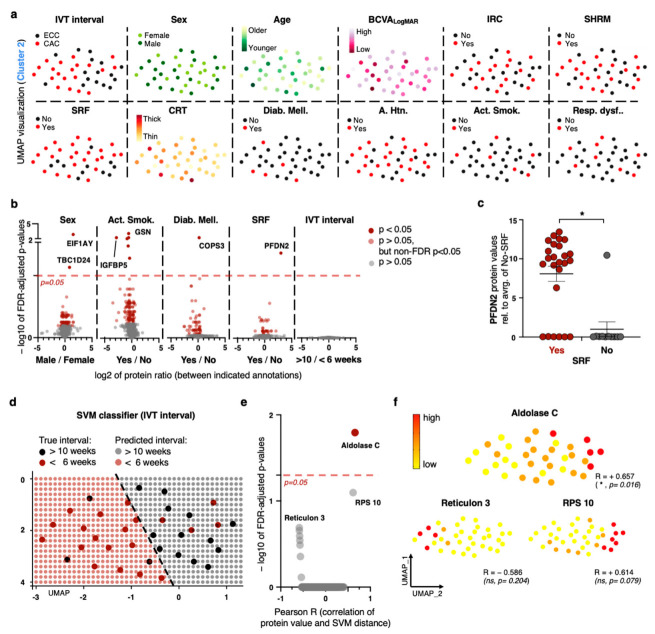
Figure 2.
Proteomic biomarker discoveries for nAMD meta-features. (a) Visualization of meta-features on UMAP dimensionality reduction of cluster 2. (b) Volcano plots for identification of proteomic biomarkers of indicated conditions. Meta-features without graphic representation yield no significant biomarkers. (c) Comparison of protein values of prefoldin subunit 2 for patients with and without SRF. (d) Linear SVM classifier categorizing samples into the two CNV control divisions (color-coded). (e) Volcano plot indicating proteomic biomarkers of SVM classifier from C based on Euclidian distance to SVM boundary. (f) Feature plot of top three significant proteins. Color-coding explained in Figure 1c. Color-coded scale provided at top left. For all graphs in this figure (if not specified otherwise): * p < 0.05, Mann–Whitney U test, FDR correction. Spearman correlation in (f).

