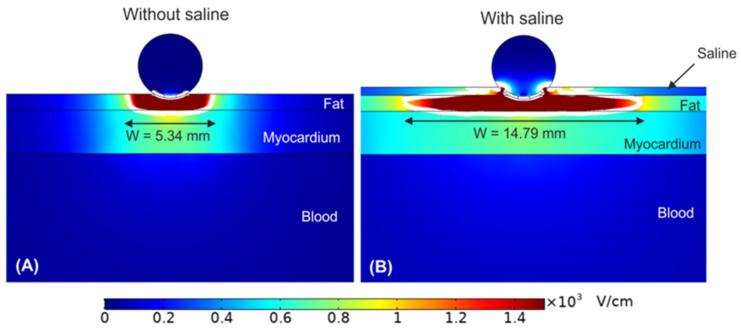
Figure 4.
Electric field distribution around the target epicardial site, without (A) and with (B) a saline layer. The electrode is embedded 0.25 mm in the fat layer. The white contour corresponds to the 1000 V/cm electric field isoline. Reprinted with permission from [66] through the Creative Commons Attribution License.

