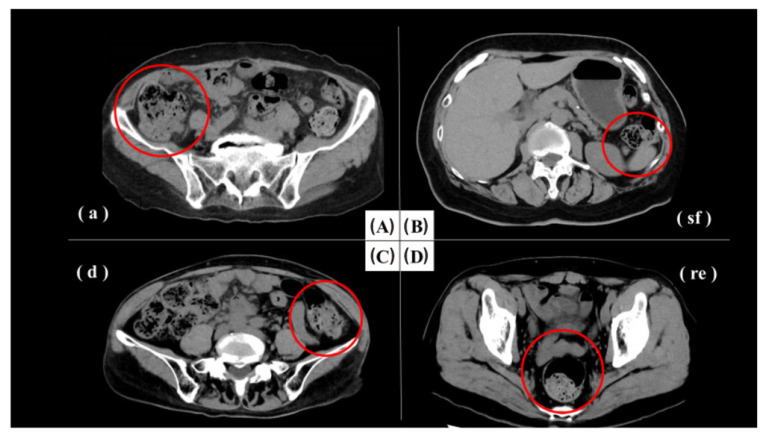
Figure 11.
Representative CT imaging for constipation diagnosis. (A) CT image was used to rate the stool volume as 4 and the gas volume as 2 (red circle). (a) Ascending colon. (B) CT image was used to rate the stool volume as 1 and the gas volume as 2 (red circle). (sf), splenic flexure. (C) CT image was used to rate the stool volume as 3 and the gas volume as 2 (red circle). (d) Descending colon. (D) CT image was used to rate the stool volume as 3 and the gas volume as 3 (red circle). (re), rectum. Reprinted with the permission of [261].

