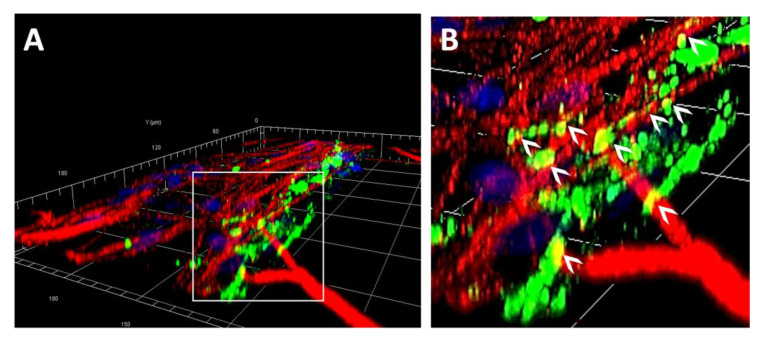
Figure 8.
A 3D reconstruction of a confocal z-stack image is shown containing a grid, with each square representing 30 × 30 microns (A) and a zoomed-in section (B). Samples were stained for fibronectin (green), β-tubulin (neurons, red) and DAPI (cell nuclei, blue) after Schwann cells and neurons had been in culture for 10 and 4 days, respectively. Neurites were observed to weave over and through (white arrowheads) the network of the native, SC-specific ECM.

