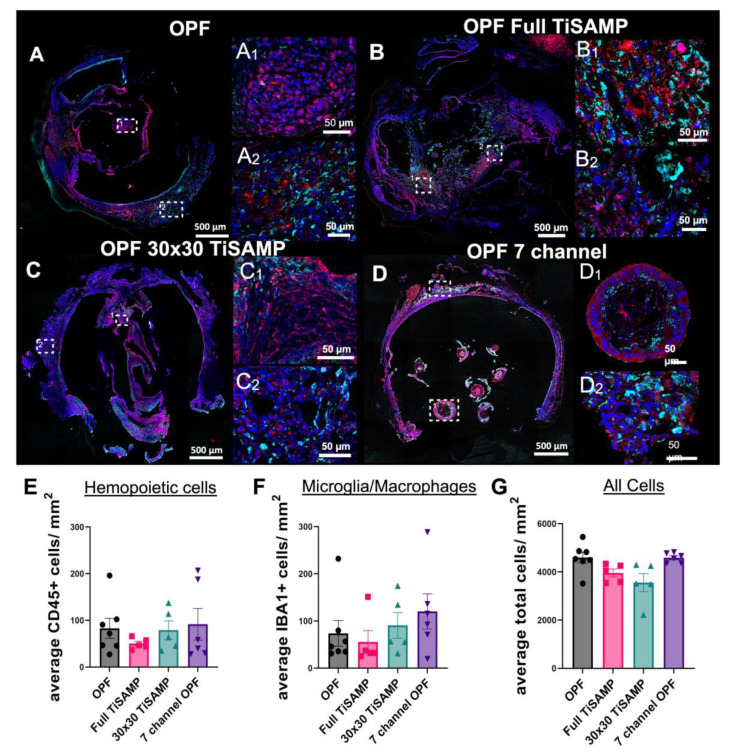
Figure 9.
Infiltration of immune cells into the implant OPF scaffolds. Implanted untreated OPF (A), Full TiSAMP (B), 30 × 30 TiSAMP (C), and seven-channel (D) scaffold were sectioned and stained at quarter lengths (¼, ½, and ¾ of the scaffold; center or ½ segment shown here) for Iba-1 (red), CD45 (cyan), and DAPI (blue) to determine the infiltration of microglia (E), hemopoietic cells (F), and all cells (G), respectively. Magnified segments of the tiled image are shown for a central portion of the scaffold (A1–D1) and the outer portion (A2–D2). A machine learning algorithm was designed to determine the number of hemopoietic cells (E), microglia (F), and all cells (G), as well as the total area of the scaffold. There was no significant difference between the conditions. One-way ANOVA with Tukey’s multiple comparisons were used. Error bars represent standard error, individual data points are displayed for each bar.

