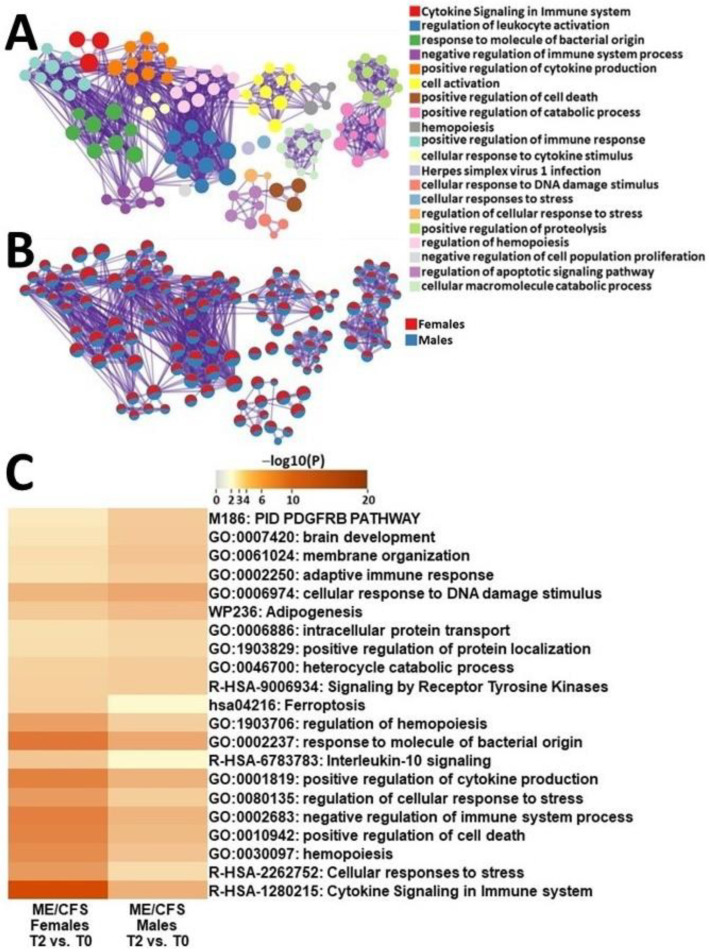
Figure 5.
Metascape express [14] analysis of differentially expressed genes between male ME/CFS patients and female ME/CFS patients between T2 and T0: (A) each node represents an enriched term. The larger the representation of the color the more differentially expressed in each cohort. Cutoff values included a p-value of <0.01, a minimum count of 3, and an enrichment factor of >1.5. GO biological processes, KEGG pathways, Reactome gene sets, CORUM complexes, and canonical pathways from MsigDB were included in the search; (B) nodes are colored by ratios between male ME/CFS and female ME/CFS patients. The red color indicates functional pathways in female ME/CFS patients while the blue color indicates functional pathways in male ME/CFS patients; and (C) heatmap of enriched terms across lists of DEGs between T2 and T0 in PBMCs of male ME/CFS patients and female ME/CFS patients.

