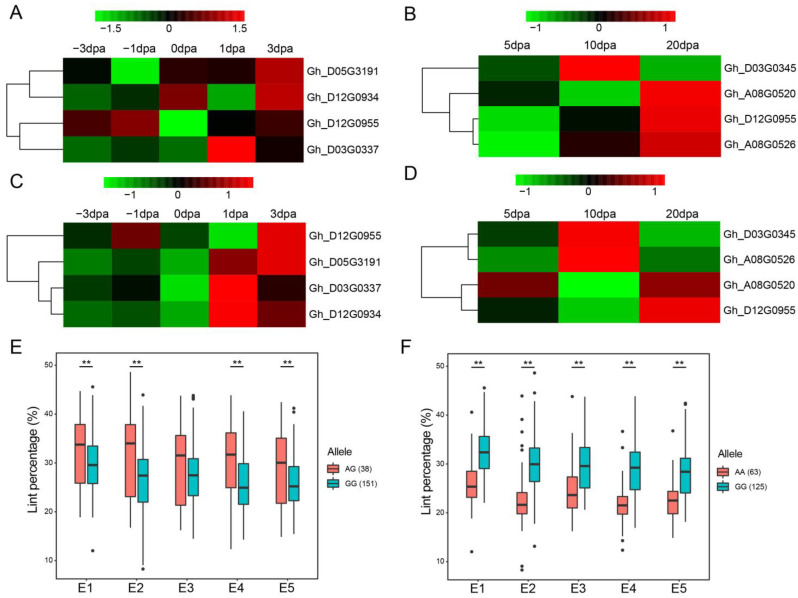
Figure 3.
Gene expression pattern of the candidate genes of lint percentage. (A) The expression pattern of candidate genes detected by RNA-seq in the ovule tissue. (B) The expression pattern of candidate genes detected by RNA-seq in the fiber tissue. (C) The expression pattern of candidate genes detected by qRT-PCR in the ovule tissue. (D) The expression pattern of candidate genes detected by qRT-PCR in the fiber tissue. (E) Box plots for lint percentage of TM78526. (F) Box plots for lint percentage of TM22226. “**”, significant at = 0.01 level. “.”, the outliers.

