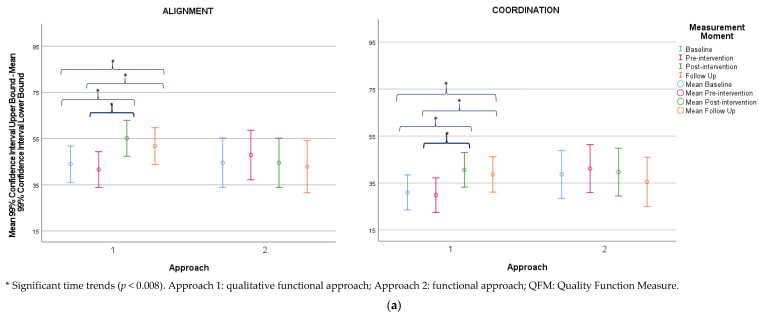
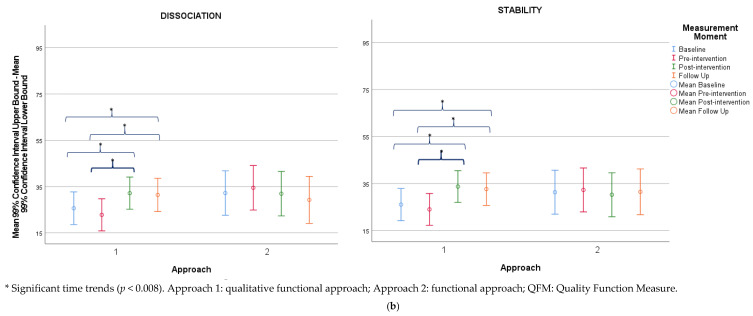
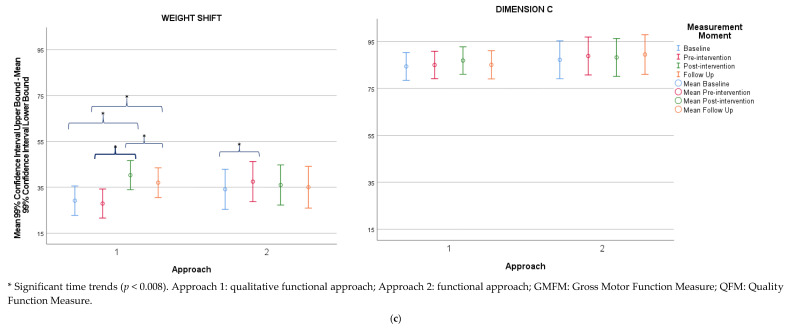
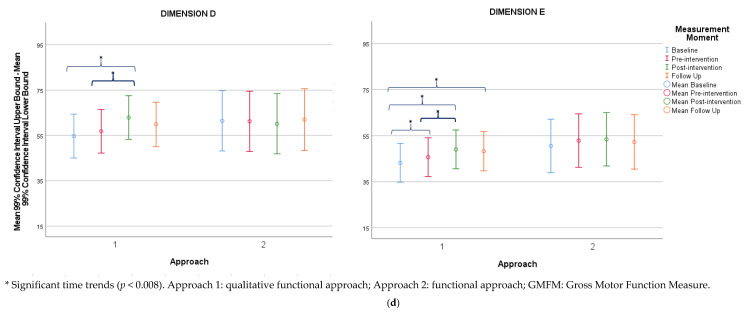
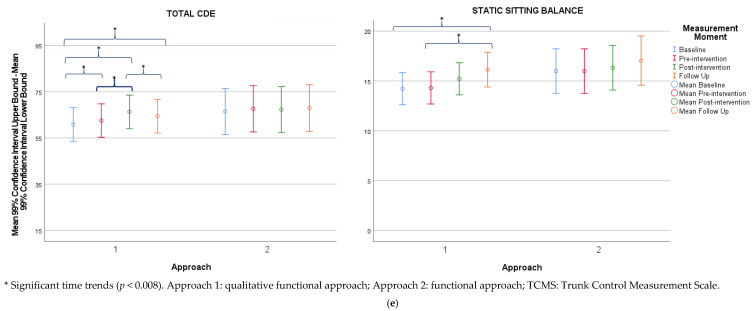
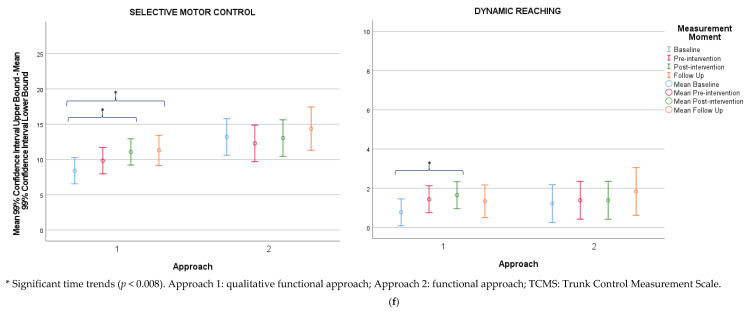
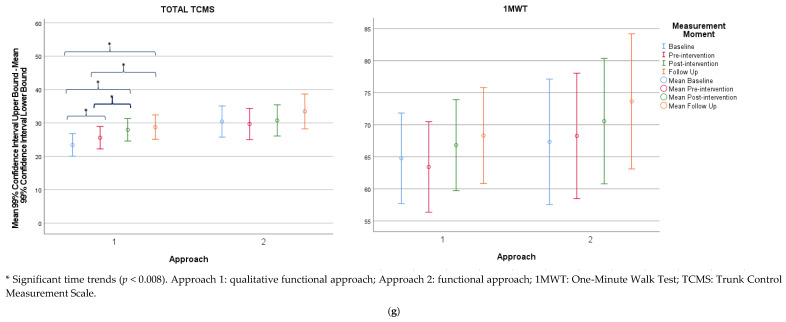
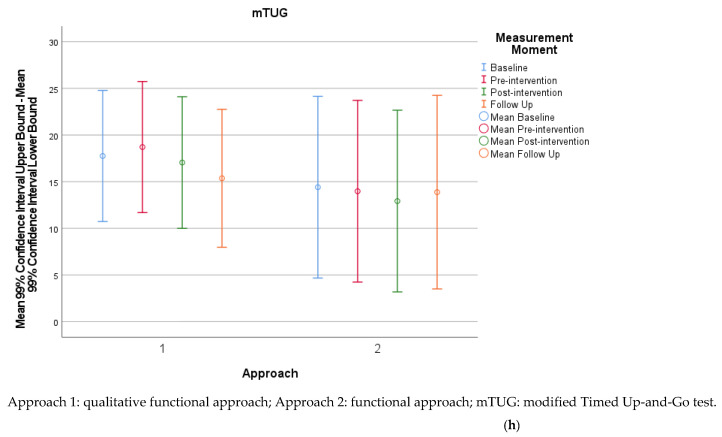
Figure 1.
(a) High–low charts of the estimated marginal means and corresponding confidence intervals for the alignment and coordination attributes of the QFM. (b) High–low charts of the estimated marginal means and corresponding confidence intervals for the dissociation and stability attributes of the QFM. (c) High–low charts of the estimated marginal means and corresponding confidence intervals for the weight shift attribute of the QFM and dimension C of the GMFM. (d) High–low charts of the estimated marginal means and corresponding confidence intervals for dimensions D and E of the GMFM. (e) High–low charts of the estimated marginal means and corresponding confidence intervals for the total CDE score of the GMFM and static sitting balance subscale of the TCMS. (f) High–low charts of the estimated marginal means and corresponding confidence intervals for the selective motor control and dynamic reaching subscales of the TCMS. (g) High–low charts of the estimated marginal means and corresponding confidence intervals for the total scores of the TCMS and 1MWT. (h) High–low charts of the estimated marginal means and corresponding confidence intervals for mTUG outcomes.

