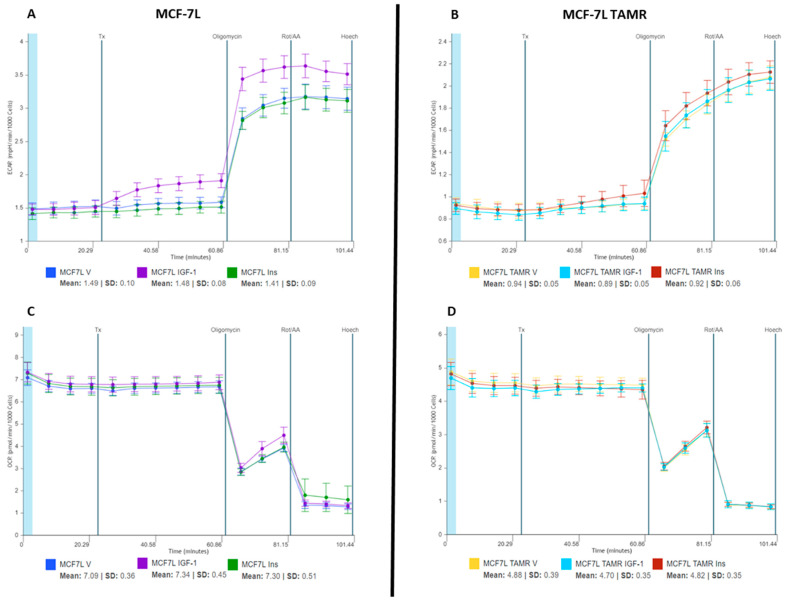
Figure 4.
The ECAR and OCR responses of MCF-7L and MCF-7L TamR cells to ligand and inhibitor treatments. Readings were normalized to per 1000 cells by using fluorescence imaging. Tx indicates 5 nM IGF-1, 10 nM insulin, and vehicle injection (Seahorse DMEM media supplemented with glucose (10 mM), L-glutamine (2 mM), and sodium pyruvate (1 mM)). (A,C) For MCF-7L cells, the ECAR and OCR results were replicated with the ligand response—10 nM IGF-1 (increase) and 5 nM insulin (no change) as compared to vehicle (Seahorse DMEM media supplemented with glucose (10 mM), L-glutamine (2 mM), and sodium pyruvate (1 mM)) (p-value for IGF-1 response compared to vehicle ≤ 1.0386 × 10⁻⁹). The dip in OCR readings and the increase in ECAR readings with Oligomycin and Rotenone/AA injection are in line with the inhibitor effect. (B,D) For MCF-7L TamR cells, the ECAR and OCR results were replicated with the ligand response—10 nM IGF-1 (no change) and 5 nM insulin (no change) as compared to vehicle (Seahorse DMEM media supplemented with glucose (10 mM), L-glutamine (2 mM), and sodium pyruvate (1 mM)). The dip in OCR readings and the increase in ECAR readings with Oligomycin and Rotenone/AA injection are in line with the inhibitor effect. A p-value < 0.05 was considered significant.

