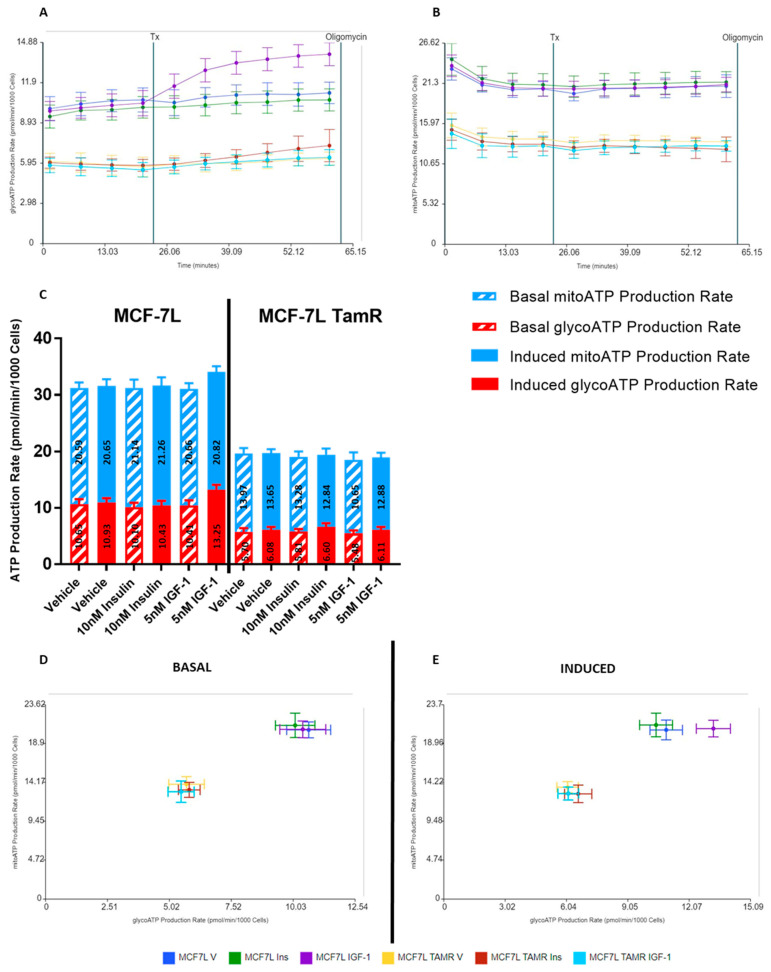
Figure 5.
Glycolytic ATP production rate increases in MCF-7L cells when stimulated with IGF-1. Readings were normalized to per 1000 cells by using fluorescence imaging. Tx indicates 5 nM IGF-1, 10 nM insulin, and vehicle injection (Seahorse DMEM media supplemented with glucose (10 mM), L-glutamine (2 mM), and sodium pyruvate (1 mM)). (A) MCF-7L cells showed an increase in glycolytic ATP production after 5 nM IGF-1 injection (p-value ≤ 1.9418 × 10⁻¹⁰), but no change was observed after 10 nM insulin injection as compared to vehicle (Seahorse DMEM media supplemented with glucose (10 mM), L-glutamine (2 mM), and sodium pyruvate (1 mM)). For MCF-7L TamR cells, there was no apparent change with either treatment. (B) mitochondrial ATP production rate remained constant after treatment injection, indicating no response. (C) There was an increase in the total ATP production for the MCF-7L group after being induced with IGF-1, while other groups did not show any change as compared to basal levels. This increase is largely due to the glycolytic ATP production rate (p-value ≤ 0.0000003). (D,E) The energetic maps further give evidence of the increase in glycolytic ATP production by MCF-7L cells when induced with 5 nM IGF-1 as compared to basal conditions. This is depicted by the shift towards glycolysis after IGF-1 treatment (p-value ≤ 0000013). At the same time, insulin shows no effect on both cell lines.

