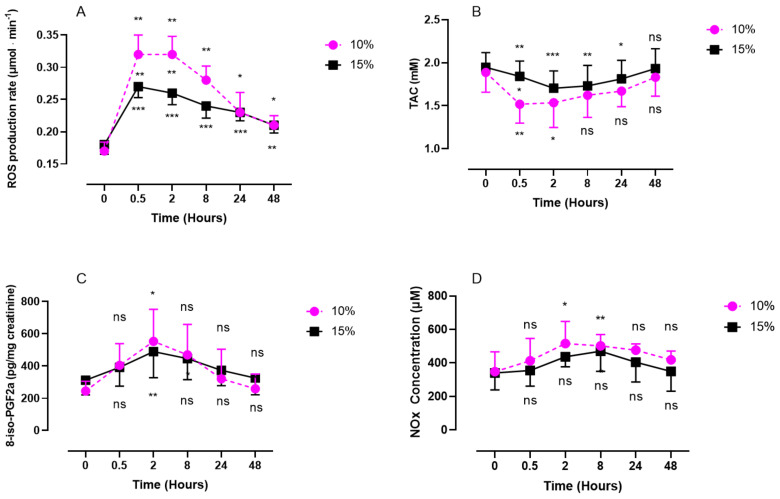
Figure 1.
Evolution of ROS production rate (A), antioxidant response (TAC) (B), 8-iso-PGF2a (C), and NOx (D) after 60 min of mild (15%, n = 8) or severe hypoxia (10%, n = 6). Results are expressed as mean ± SD. T0 represents the pre-exposure baseline. Intra-group comparisons between results at T0 and each other time point are represented above and below the respective curves. Inter-group comparisons between 10% and 15% of oxygen exposure when significant are shown between the two curves (ns: not significant; *: p < 0.05, **: p < 0.01, ***: p < 0.001).

