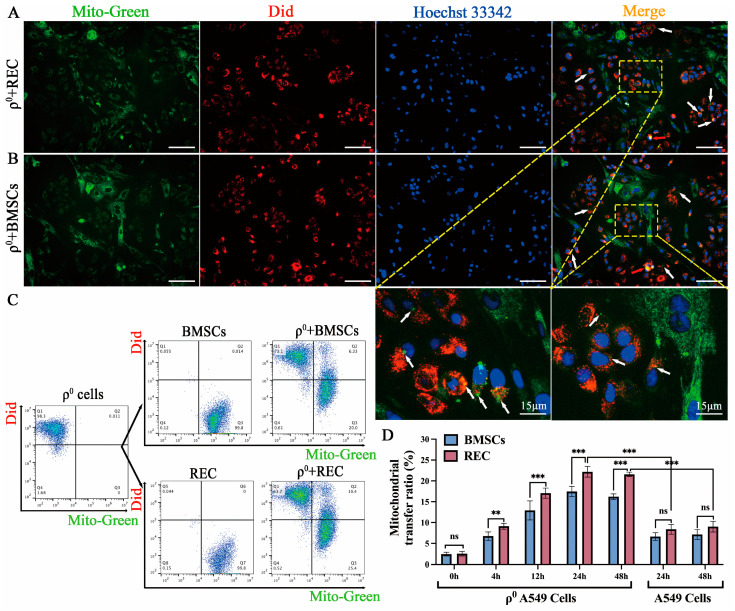
Figure 1.
ρ0 cells receive mitochondria from REC or BMSCs. (A) Representative images of RECs (green fluorescence) with ρ0 cells (red fluorescence) in the direct-contact system. (B) Representative images of BMSCs (green fluorescence) with ρ0 cells (red fluorescence) in the direct-contact system. White arrows: Mitochondria transferred from RECs/BMSCs into ρ0 cells. Red arrows: transferred mitochondrial clusters. Scale bars, 100 μm. (C) Flow cytometry analysis of MitoGreen-stained RECs/BMSCs, DiD-stained ρ0 cells, and representative distribution under coculture. (D) Time course of mitochondrial transfer ratios between RECs/BMSCs and ρ0 cells at the Q2 phase, and between RECs/BMSCs and A549 cells (n = 3). Data represent the mean ± standard deviation of three independent experiments. Ns, not significant. ** p < 0.01, *** p < 0.001.

