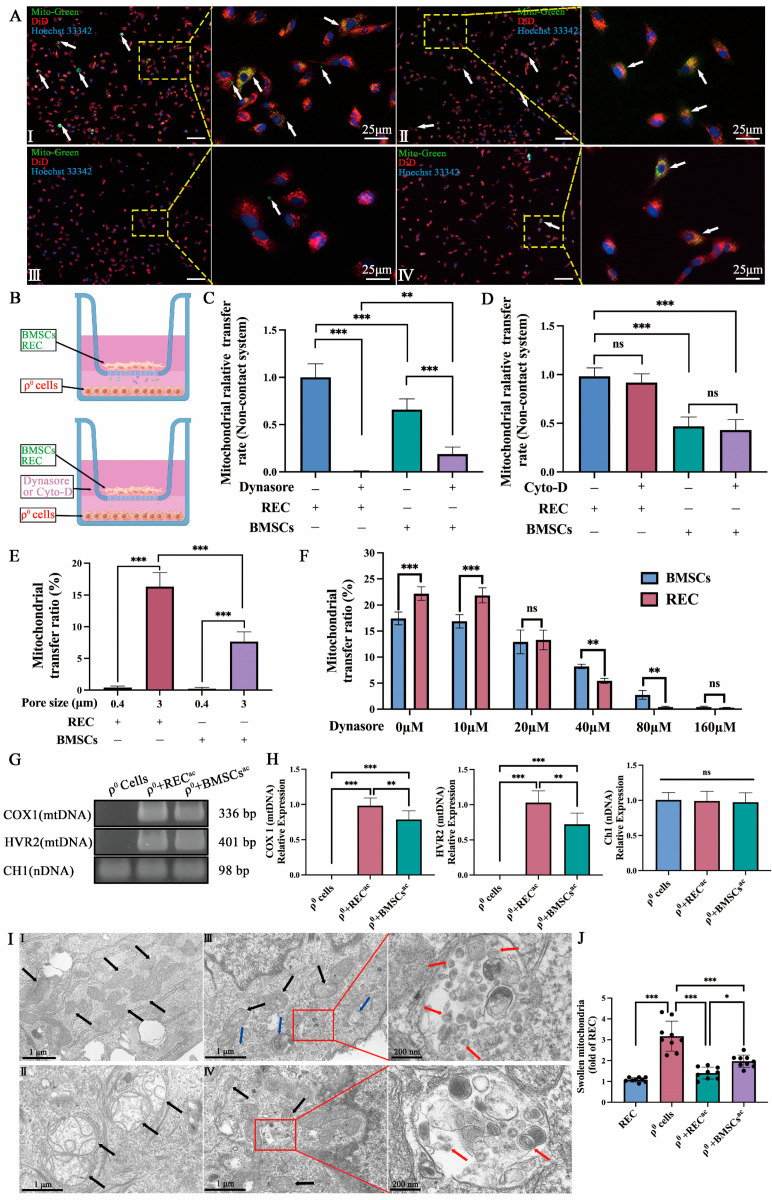
Figure 4.
Mitochondrial transfer in the noncontact system. (A) Fluorescence images of ρ0 cells under coculture with RECs (I) and BMSCs (II), respectively, in a 3 μm pore size cell culture insert; ρ0 cells cocultured with RECs (III) and BMSCs (IV), respectively, in a 3 μm pore size cell culture insert with Dynasore. Mito-Green labeled RECs or BMSCs, DiD (red), and Hoechst33342 (blue) labeled ρ0 cells. White arrows: mitochondria from RECs/BMSCs received by ρ0 cells. Scale bar, 150 µm. (B) Schematic diagram of the noncontact system (with or without Dynasore/Cyto-D, an inhibitor of cellular endocytosis/inhibitor of TNTs). (C) Relative rates of mitochondrial transfer from RECs and BMSCs to ρ0 cells with and without Dynasore treatment (n = 3). (D) Relative rates of mitochondrial transfer from RECs and BMSCs to ρ0 cells with and without Cyto-D treatment (n = 3). (E) Rates of mitochondrial transfer from RECs and BMSCs in different coculture systems (0.4 μm and 3 μm pore size cell culture insert) (n = 3). (F) Rates of mitochondrial transfer from RECs and BMSCs at different Dynasore concentrations (n = 3). (G) Total DNA was isolated from ρ0 cells, ρ0 cells cocultured with RECs in the noncontact system (ρ0 + RECac), and ρ0 cells cocultured with BMSCs in the noncontact system (ρ0 + BMSCsac). PCR was performed to detect mitochondrial DNA (Cytochrome c oxidase I (COX1) and hypervariant region 2 (HVR2) and nuclear DNA (chromosome 1 segment (CH1). Notably, no mtDNA was detected in ρ0 cells. (H) RT-PCR quantification of the relative expression of COX1, HVR2, and CH1 in ρ0 cells, ρ0 + RECac, and ρ0 + BMSCsac (n = 3). (I) Representative TEM images showing the mitochondrial morphology of RECs (I), ρ0 cells (II), ρ0 cells cocultured with RECs for 24 h (III), and ρ0 cells cocultured with BMSCs for 24 h (IV). Black arrows: typical mitochondria of each group of cells; blue arrows: mitochondria in microvesicles; red arrows: apparently exosomes. (J) Quantification of mitochondrial swelling in different groups of cells (n = 3). Cyto-D: Cytochalasin D. ac: apical chamber: represents cells cultured in the apical chamber. Data represent the mean ± standard deviation of three independent experiments. ns, not significant. * p < 0.05, ** p < 0.01, *** p < 0.001.

