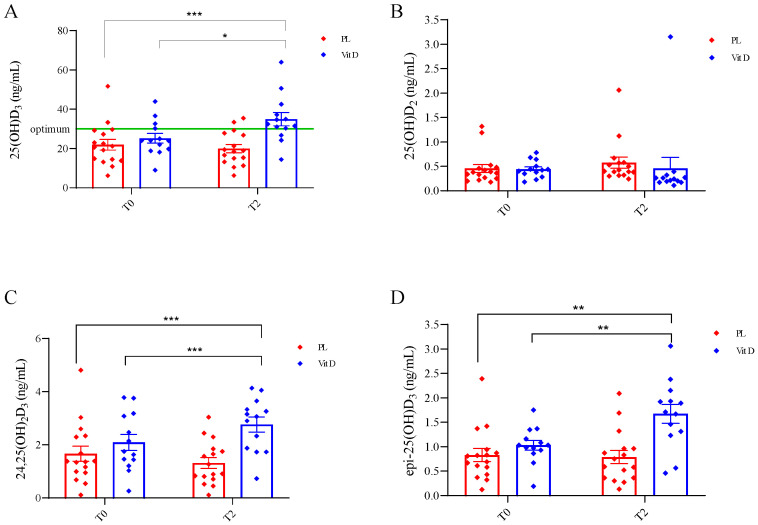
Figure 1.
The effect of supplementation on vitamin D metabolites. (A) Changes in serum concentrations of 25(OH)D3. (B) Changes in serum concentrations of 25(OH)D2. (C) Changes in serum concentration of 24,25(OH)2D3. (D) Changes in serum concentrations of epi-25(OH)D3. * p < 0.0006, ** p < 0.005, *** p < 0.05. T0—before the supplementation; T2—after 12 weeks of supplementation; PL—placebo group; VitD—vitamin D3 group; whiskers refer to standard error (SE).

