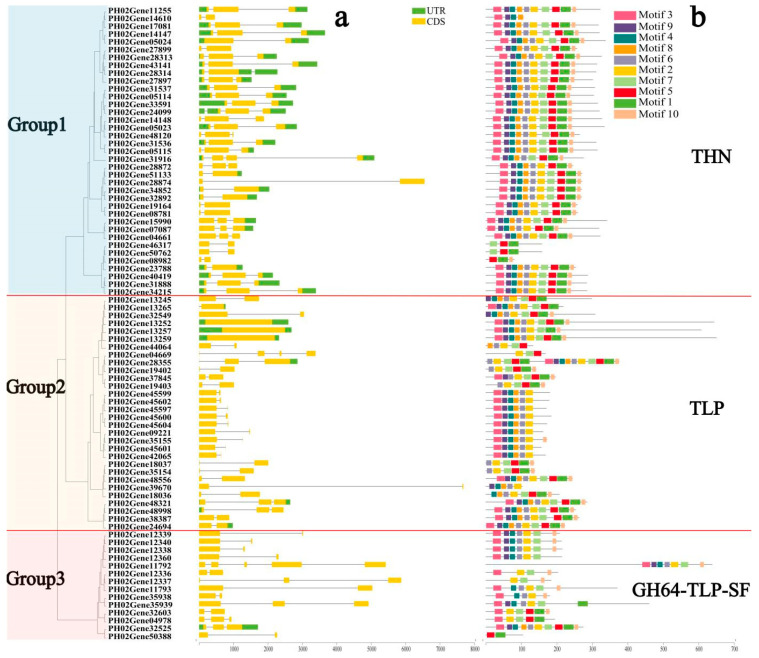
Figure 2.
Phylogenetic tree, gene structures, and conserved motifs of PeTLPs. (a) Phylogenetic tree and gene structures. CDS is indicated by yellow boxes, UTR regions are indicated by green boxes, and the intron is indicated by a black line. The scale at the bottom is in base pair (bp). (b) Motif analysis of PeTLPs. The length of the solid line represents the length of the protein sequences. Colored boxes represent different motifs.

