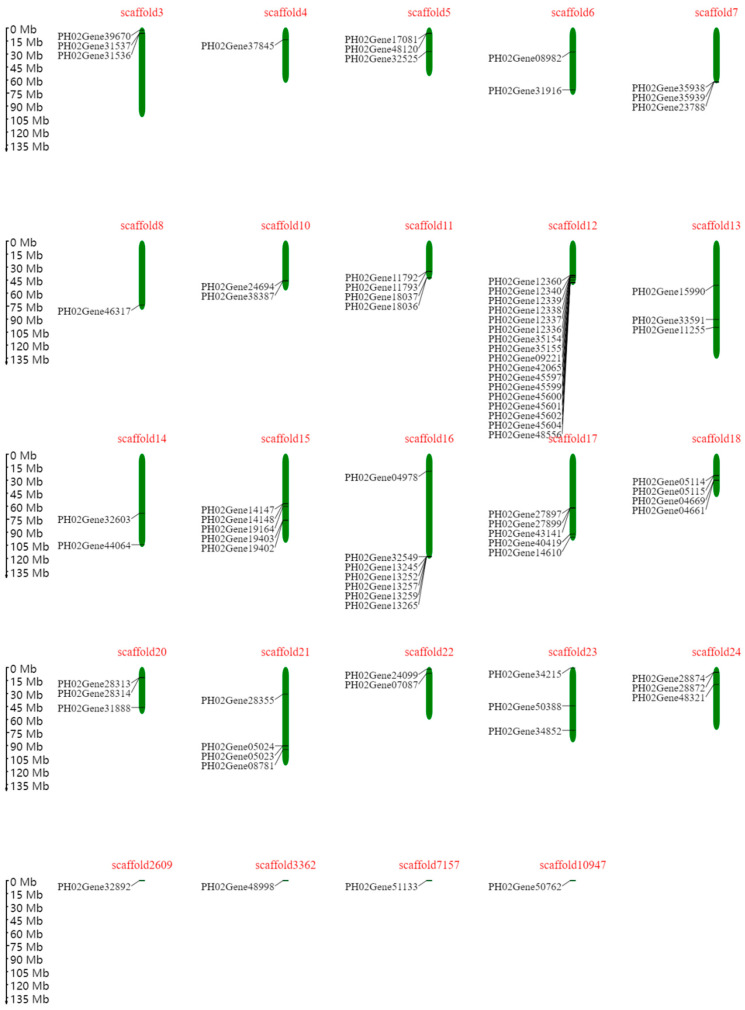
Figure 4.
Distribution of PeTLP genes on scaffolds in P. edulis. Scaffolds are represented by green bar boxes, and the different horizontal lines on the scaffold represent the genes at different locations. The scaffold numbers are indicated at the top of the scaffolds. The scale on the left is in megabases (Mb).

