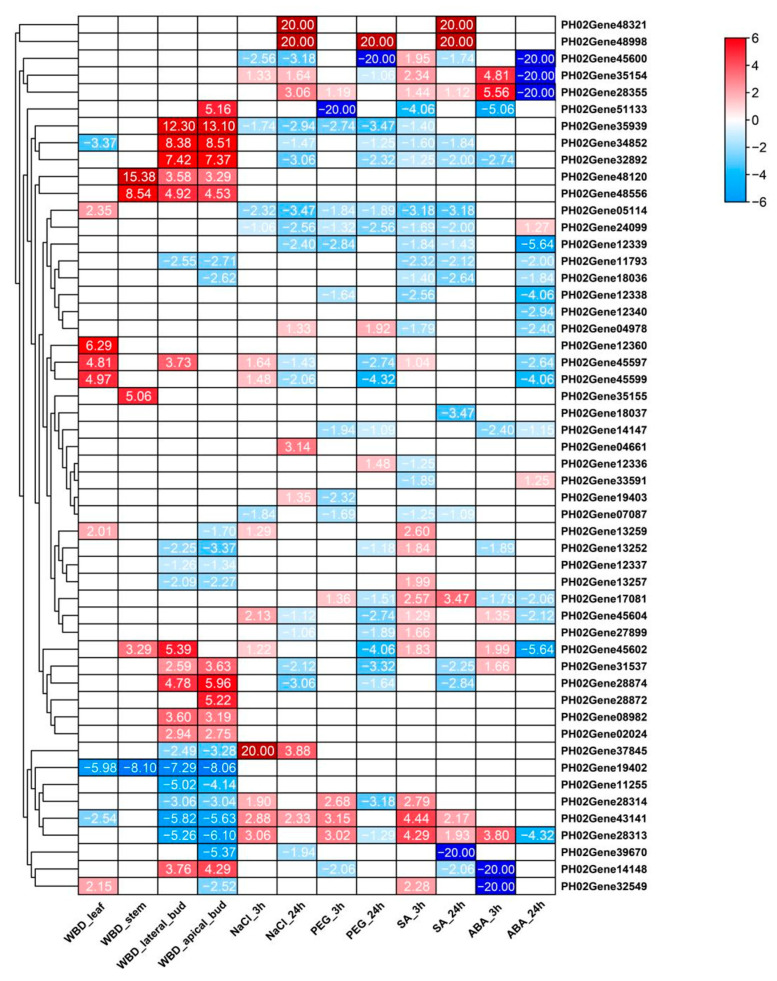
Figure 8.
Heatmap of transcriptional expression levels of PeTLPs in P. edulis witches’ broom disease (WBD) within different tissues, and the corresponding response to NaCl, polyethylene glycol (PEG), salicylic acid (SA), and abscisic acid (ABA) stress, expressed as Log2FC values. Blocks with colors indicate the level of upregulation (red) or downregulation (blue). White blocks indicate genes that are not differentially expressed.

