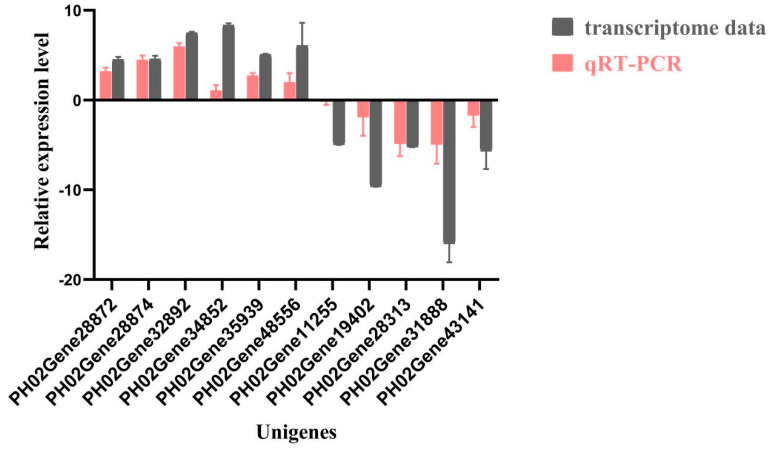
Figure 9.
Gene expression of identified PeTLPs in the buds after fungal infection. The X-axis indicates the names of the 11 DEGs in bamboo buds, while the Y-axis shows the gene expression level. These values are represented by mean ± SDs, and the line in the bar indicates standard deviations. Brown bars represent transcriptome results, and red bars indicate qRT-PCR results.

