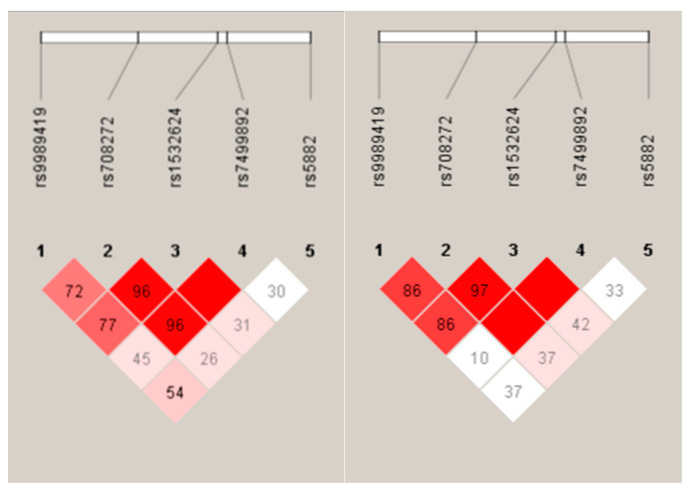
Figure 1.
Linkage disequilibrium (LD) map (based on D-prime–D’) of single-nucleotide polymorphisms in the CETP gene in the control (left) and case (right) group. Dark red indicates high LD (D′ = 1 and log of the odds–LOD > 2). Lower LD values are indicated by pink shades (0.21 < D′ < 1 and LOD > 2). White indicates low LD and low LOD (LOD < 2). The number within each box indicates the D statistic value between the corresponding two SNPs.

