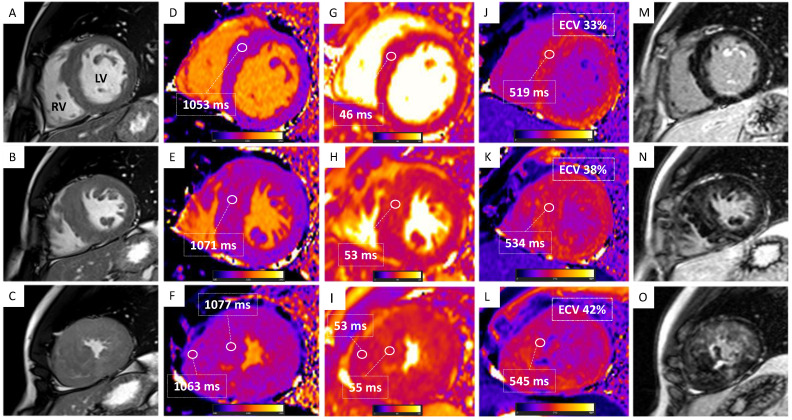
Figure 3.
Multiparametric cardiac magnetic resonance tissue characterization. Basal (upward), mid (mid), and apical (downward) short-axis views are shown. (A–C) Balanced Steady State Free Precession (bSSFP) short-axis views showing hypertrophy of the mid-apical segments of the left ventricle (LV) and hypertrophy of the right ventricular (RV) wall. (D–F) Modified Look-Locker inversion recovery (MOLLI) T1-mapping showing elevated native T1 with increasing values from base to apex; elevated T1 values of the RV free wall are also shown. (G–I) True fast imaging with steady-state precession (True-FISP T2) mapping showing elevated native T2 values at the apex. (J–L) MOLLI post-contrast T1-mapping showing elevated post-contrast T1 and elevated extracellular volume (ECV) with increasing values from base to apex. (M–O) Magnitude reconstruction (MAG) late gadolinium enhancement (LGE) showing LGE of the mid-apical segments of the LV and RV.

