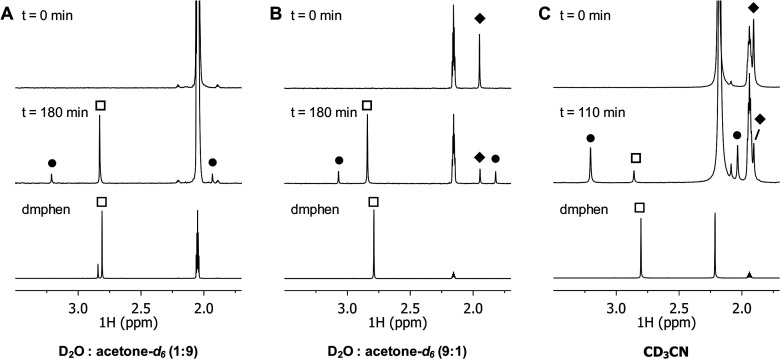
Figure 2.
Evolution of the 1H NMR spectrum (δ = 3.5–1.7 ppm) of [2a](PF6)2 (tilted square solid) under irradiation with white light in D2O:acetone-d6 (1:9 v/v (A) or 9:1 v/v (B) or CD3CN (C)) at 298 K under N2, also showing the 1H NMR spectrum of the photoproduct 2,9-dimethyl-1,10-phenanthroline (empty squares). Peaks belonging to the photoproduct cis-[Ru(bpy)(dmphen)(Sol)2]2+ are labeled as circle solid. In panels A and C, the peak belonging to the starting compound [2a](PF6)2 is (partially) obscured by the residual solvent signals (δacetone-d6 = 2.05 ppm; δCD3CN = 1.94 ppm).

