
Figure 3.
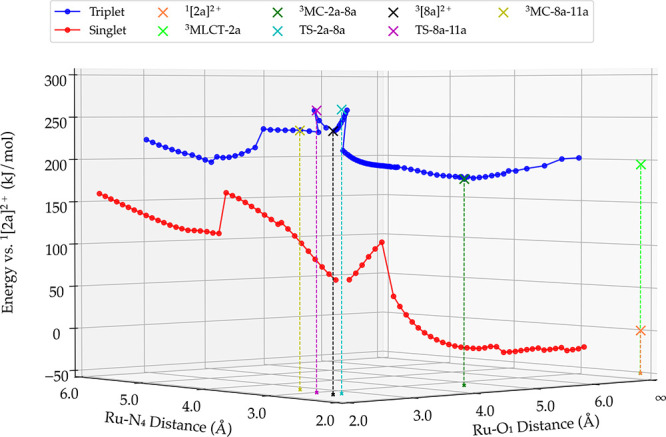
One example of a linear transit plot obtained for the singlet ground state (red) and for the triplet-excited state (blue) for pathway 3 of complex [2a]2+ in water. The Ru-O1 distance that was constrained during linear transit calculations is plotted on the x-axis, the distance involving the second step of the substitution (here, Ru-N4) is shown on the y-axis, and the energy (in kJ/mol) relative to the ground state 1[2a]2+ is plotted on the z-axis. See Schemes S4 and S5 for the formulae of all intermediates and species on the singlet and triplet hypersurface.