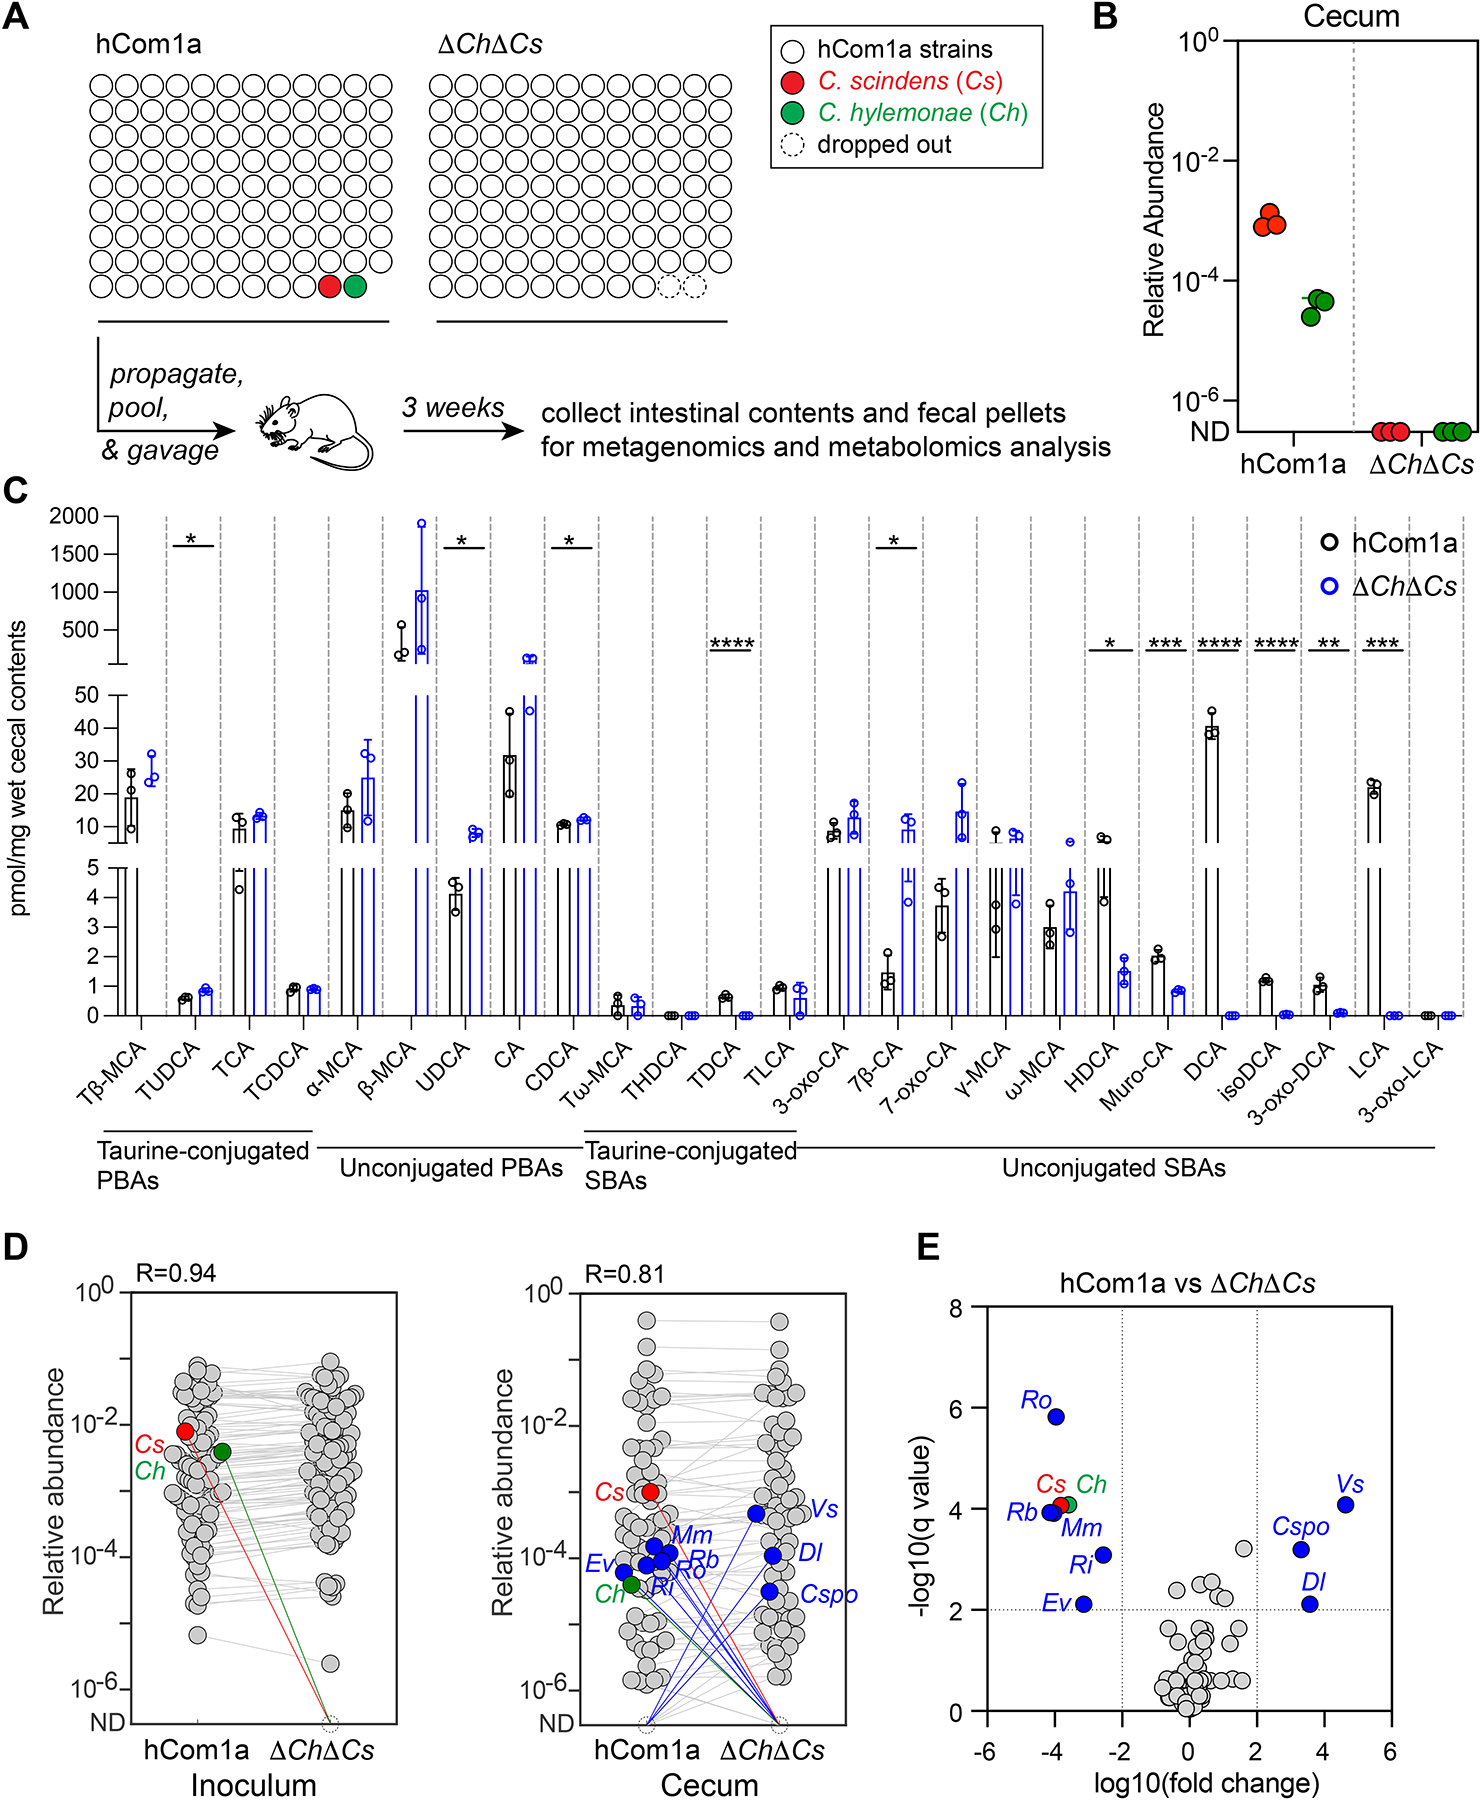
Figure 3: Metabolic and ecological impacts of removing strains in the 7α-dehydroxylation niche.

(A) Schematic of the experiment. Germ-free C57BL/6 mice (n=3 per group) were colonized with hCom1a or ΔChΔCs and housed for 3 weeks before sacrifice. Fecal pellets and intestinal contents were subjected to metagenomic analysis or targeted metabolite profiling. (B) Cs and Ch are undetectable in ΔChΔCs-colonized mice. Relative abundances were calculated through a high-resolution metagenomic analysis of the inoculum and cecal communities. (C) Secondary bile acids are eliminated in ΔChΔCs-colonized mice. Bile acids were quantified in cecal contents by targeted LC-MS-based profiling. Statistical significance was assessed using a Student’s two-tailed t-test (*: p<0.05; **: p<0.01; ***: p<0.001; ****: p<0.0001). PBAs: primary bile acids; SBAs: secondary bile acids. (D) Average relative abundances of the inoculum (left) versus the cecal communities at week 3 (right). Each dot is an individual strain; the collection of dots in a column represents the community averaged over 3 mice co-housed in one cage. Cs and Ch are highlighted in red and green, respectively. Strains highlighted in blue went up or down in relative abundance between hCom1a-colonized and ΔChΔCs-colonized mice (FDR < 0.01, fold change > 100). (E) Volcano plot of differential strain relative abundance. The log10(fold change) values of each strain are shown; relative abundances were set at 10−8 for strains not detected. Relative abundances were analyzed using a multiple unpaired t test, corrected with FDR (Q<1%). Strains discovered with significantly different relative abundance (FDR<0.01, fold change >100) are colored blue; the full names of the blue strains can be found in Figures 5D. See also Figure S2, and Table S3 and S4.
