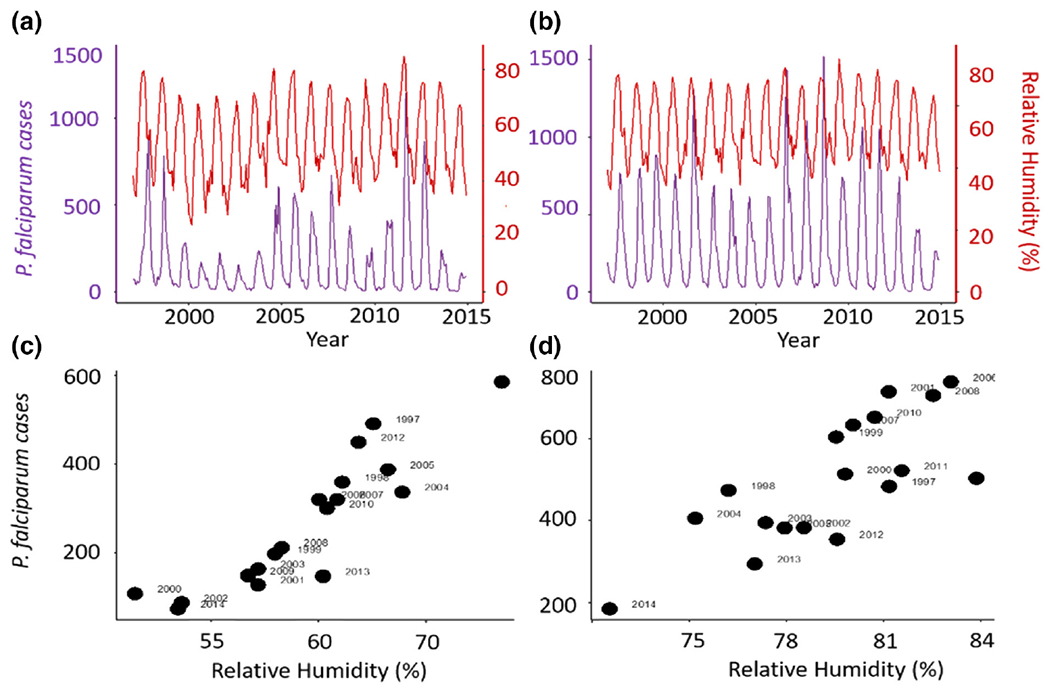
FIGURE 2.

Monthly malaria case data for Plasmodium falciparum shown (in purple) with a corresponding time series for relative humidity (RH, red) for two cities in India, Ahmedabad (a) and Surat (b). Total cases during the transmission season from August to November are shown as a function of mean RH in a critical time window preceding this season and including the monsoons from May to July for Ahmedabad (c) and March to July for Surat (d). Figure is taken from Santos-Vega et al. (2022) Nature Communications doi: 10.1038/s41467-022-28,145-7. Figure is reproduced under Creative Commons Attribution 4.0 International Licence.
