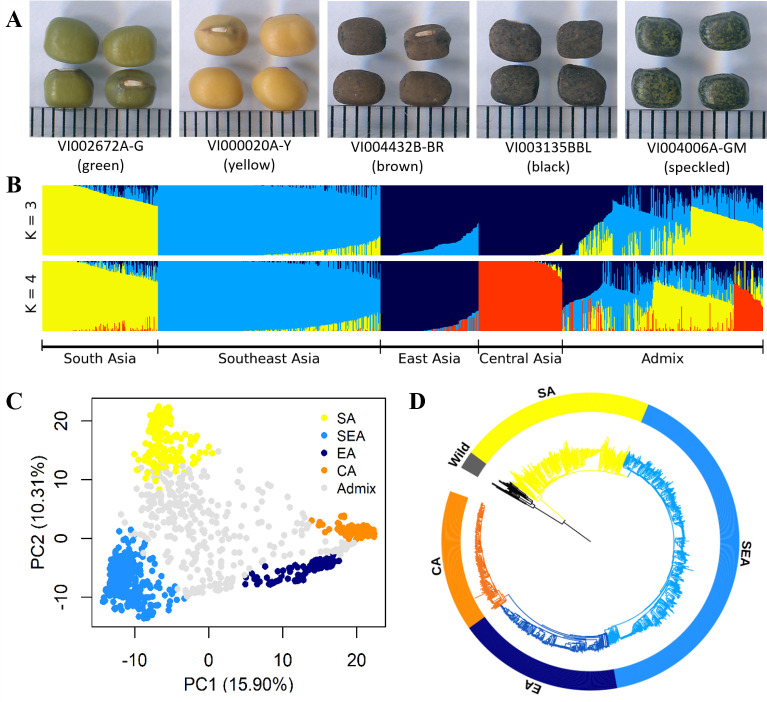
Figure 1. Diversity of worldwide mungbean.
(A) Variation in seed color. (B) ADMIXTURE ancestry coefficients, where accessions were grouped by group assignments (Q≥0.7). (C) Principal component analysis (PCA) plot of 1092 cultivated mungbean accessions. Accessions were colored based on their assignment to four inferred genetic groups (Q≥0.7), while accessions with Q<0.7 were colored gray. (D) Neighbor-joining (NJ) phylogenetic tree of 788 accessions with Q≥0.7 with wild mungbean as outgroup (black color).


