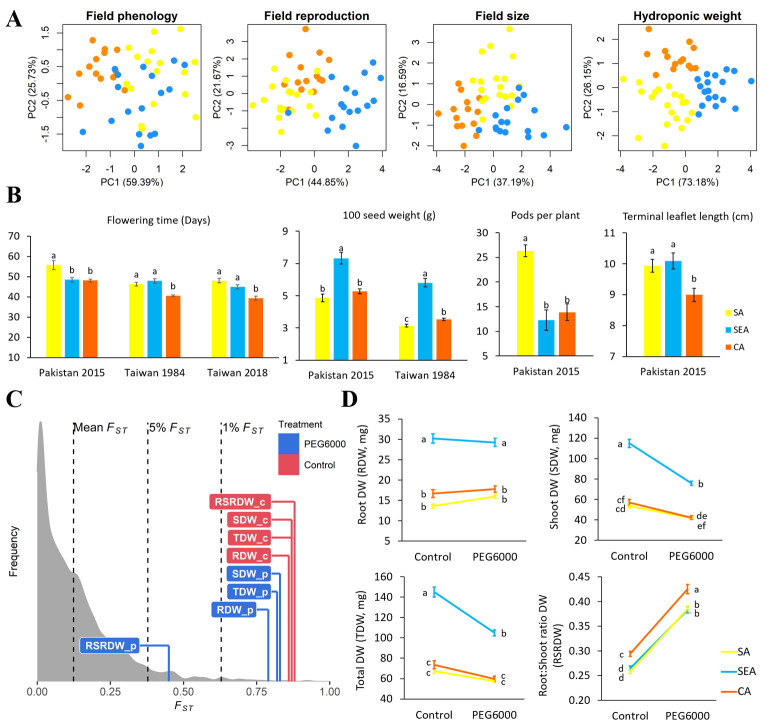
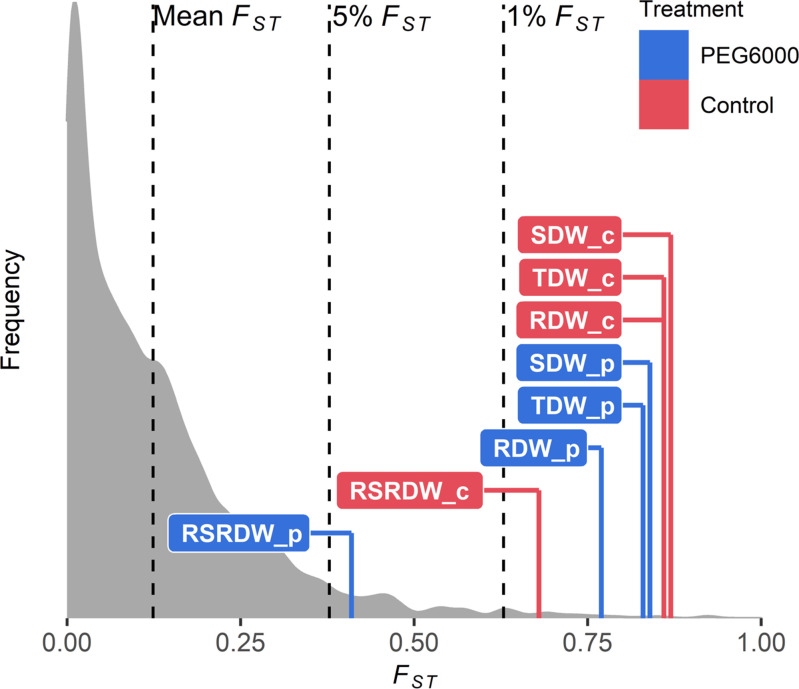
Figure 4. Quantitative trait differentiation among genetic groups.
(A) Principal component analysis (PCA) of four trait categories. (B) Trait variability from common gardens in field experiments. Sample size of SA, SEA, and CA are 18, 17, and 14, respectively. (C) Comparison of QST-FST for four drought-related traits under two environments. FST values (mean, 5%, and 1%) were indicated by black dashed lines. The QST for each trait was colored according to treatment and was calculated as Equation 2 in Materials and methods. Abbreviations: RDW: root dry weight; SDW: shoot dry weight; TDW: total dry weight; RSRDW: root:shoot ratio dry weight; c: control; p: PEG6000. (D) Effect of PEG6000 (–0.6 MPa) on RDW, SDW, TDW, and RSRDW among genetic groups. Sampe size of SA, SEA, and CA are 20, 18, and 14, repectively. Data were expressed as the mean ± SE. Lowercase letters denote significant differences under Tukey’s honestly significant difference test in (B) and (D).


