
Figure 2. Overview of ROI definition and validation of the quality of subcortical fMRI data.
(A) All subcortical ROIs overlaid on the group T1 template. (B) Individual data points showing the temporal signal-to-noise ratio for each ROI for session 1 (left) and session 2 (right; black points indicate the mean). (C) Correlation matrix showing that activity in subcortical nuclei co-varied positively with activity in other subcortical nuclei, with the strongest coupling present between the VTA and SN, which is to be expected given their close proximity, and the weakest (negative correlation) between the VTA and DR. Note: correlations were FDR-corrected and controlled for activity in the pons (n = 70). (D) FSE image of an example participant. Hyperintensities corresponding to the LC are visible in the yellow box (top). Using the FSE images, the LC (red) was manually delineated on the individual level following established protocols (Clewett et al., 2016; Mather et al., 2017). The graph shows the LC contrast-to-noise ratio for all participants (n = 67). The gray dot indicates the grand mean. LC, locus coeruleus; VTA, ventral tegmental area; SN, substantia nigra; DR, dorsal raphe; MR, medial raphe; BF, basal forebrain; ACC, anterior cingulate cortex; OCC, calcarine sulcus; CNR, contrast-to-noise ratio; ROI, region of interest; fMRI, functional magnetic resonance imaging; FDR, false discovery rate. Source data used to generate this figure is available in Figure 2—source data 1.

Figure 2—figure supplement 1. Overview of template building and coregistration steps performed in ANTs.
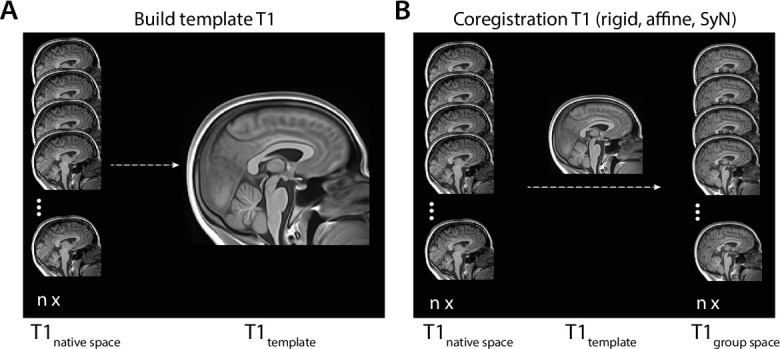
Figure 2—figure supplement 2. Anatomical verification of accurate registration.
