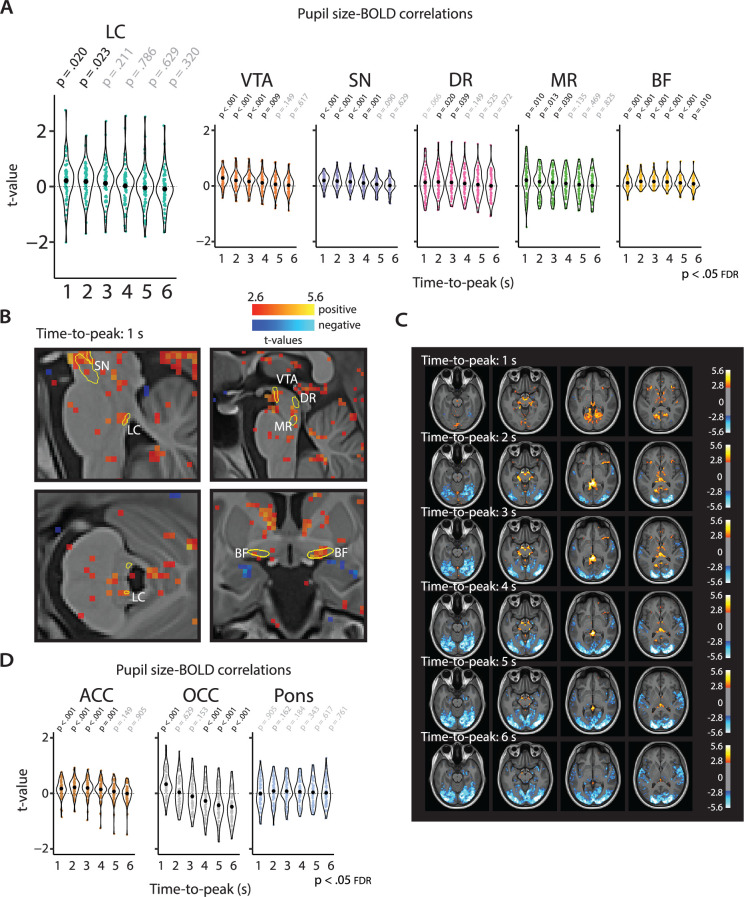
Figure 4. Pupil-BOLD correlations based on systematic adjustment of the TTP of the HRF.
Graphs show the extracted t-statistics as a function of the systematically adjusted TTP for each participant in the subcortical ROIs (A) and the validation and control ROIs (D). p-Values refer to one-sample t-tests (difference from zero; FDR-corrected). Black dots indicate the mean. (B) Statistical maps showing pupil-BOLD correlations in the subcortex for the 1 s TTP. (c) Statistical maps showing unsmoothed pupil-BOLD correlations across the cortex for each TTP (1–6 s). All statistical maps were thresholded at p<0.005 (uncorrected) for visualization purposes only (n = 70). LC, locus coeruleus; VTA, ventral tegmental area; SN, substantia nigra; DR, dorsal raphe; MR, median raphe; BF, basal forebrain; ACC, anterior cingulate cortex; OCC, calcarine sulcus; BOLD, blood oxygen level-dependent; FDR, false discovery rate; TTP, time-to-peak; HRF, hemodynamic response function; ROI, region of interest. Source data used to generate this figure is available in Figure 4—source data 1.


