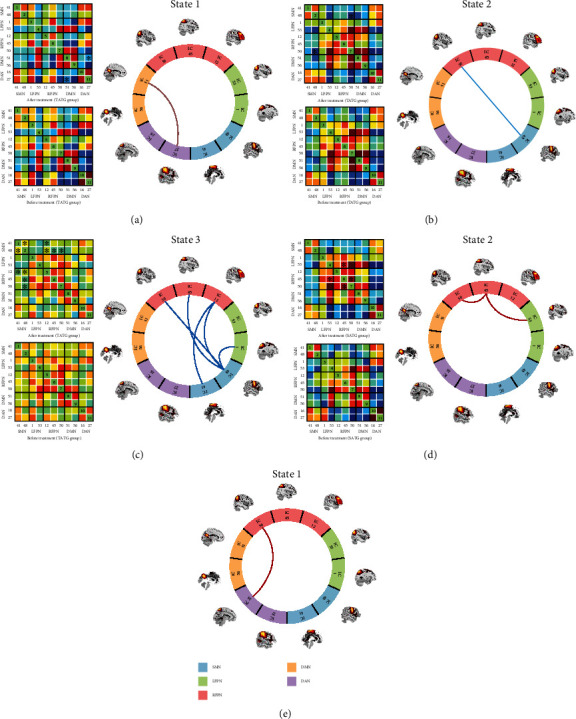
Figure 5.

Differences in functional connectivity among distinct states. Specific connectivity matrix (left) and circle plots of significant difference in connectivity states (right) (a–d). The significant difference in specific state is marked by asterisk (∗ represents P < 0.05). In circle plots, red lines indicate increased functional connectivity (FC) between or within networks. Blue lines indicate decreased FC between or within networks. (a–d) The significant connectivity differences after treatment compared to before treatment in the TATG group or the SATG group. (a) Increased FC between DAN and DMN in state 1 in the TATG group. (b) Reduced FC between RFPN and SMN in state 2 in the TATG group. (c) Reduced FC between FPN and SMN in state 3 in the TATG group. (d) Increased FC in FPN in state 2 in the SATG group. (e) Positive effect between DAN and RFPN in state 1 between the two groups, which means increased FC between DAN and RFPN in state 1 in the TATG group compared to the SATG group. SMN: sensorimotor network. LFPN: left frontoparietal network. RFPN: the right frontoparietal network. DMN: default mode network. DAN: dorsal attention network.
