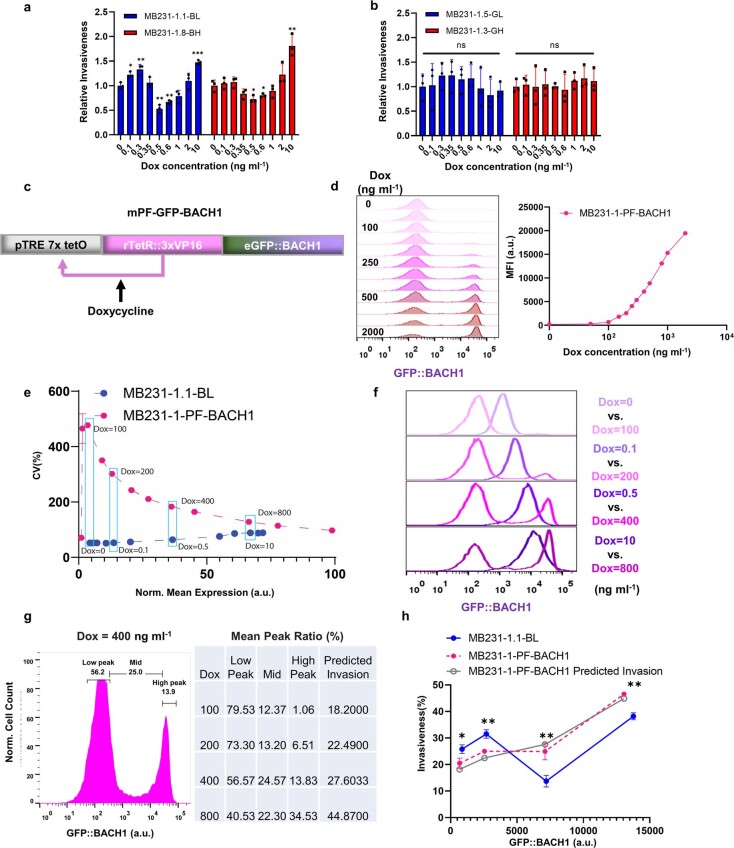
Extended Data Fig. 5. Invasion effects of BACH1 expression noise are landscape-dependent.
(a) Relative invasiveness of low-noise mNF-BACH1 (BL) and high-noise mNF-BACH1 (BH) clones at each Dox concentration with respect to the uninduced controls. Two-tailed t-test between uninduced control and every other dose, n = 3, *P < 0.05, **P < 0.01, ***P < 0.001. (b) Relative invasiveness of low-noise mNF-GFP (GL) and high-noise mNF-GFP (GH) clones at each Dox concentration with respect to the uninduced controls. n = 3, one-way ANOVA, P > 0.05. (c) Synthetic mammalian Positive-Feedback (mPF) gene circuit for Dox-induced co-expression of reverse tetracycline-controlled transactivator (rtTA) and GFP::BACH1 fusion protein (mPF-BACH1). TetO: Tetracycline Operator; VP16: Virus Protein 16 transcription activator. (d) Left panel: Representative dose-responses of fluorescence intensity histograms from mPF-BACH1 integrated MB231 clone measured at 0, 50, 100, 150, 200, 250, 300, 400, 500, 800, 1000 and 2000 ng ml−1 Dox levels, respectively. Right panel: Dose-responses of mean fluorescence intensity (MFI) for MB231 mPF-BACH1 clone (n = 3, Dox=10 corresponds to Dox=0). (e) Plotting the noise (CV) as a function of normalized mean gene expression for both low-noise mNF-BACH1 and mPF-BACH1 clones of MB231. Total four mean-noise decoupling pairs were selected based on the minimum mean differences between mNF and mPF populations. (f) Representative histograms of selected mean-noise decoupling pairs in (e). (g) Deconstruction of BACH1 expression distribution among mPF-BACH1 population in the context of invasion landscape. Invasiveness predictions for each dose were based on each subpopulation’s mean invasiveness in the context of invasion landscape in Fig. 3e. Mean Peak Ratio was averaged over 3 independent replicates. (h) Comparison of invasiveness for mPF versus mNF cells at four selected decoupled noise points along with mPF cell invasion predicted computationally. Two-tailed t-test for each experimental pair, n = 3, *P < 0.05, **P < 0.01.

