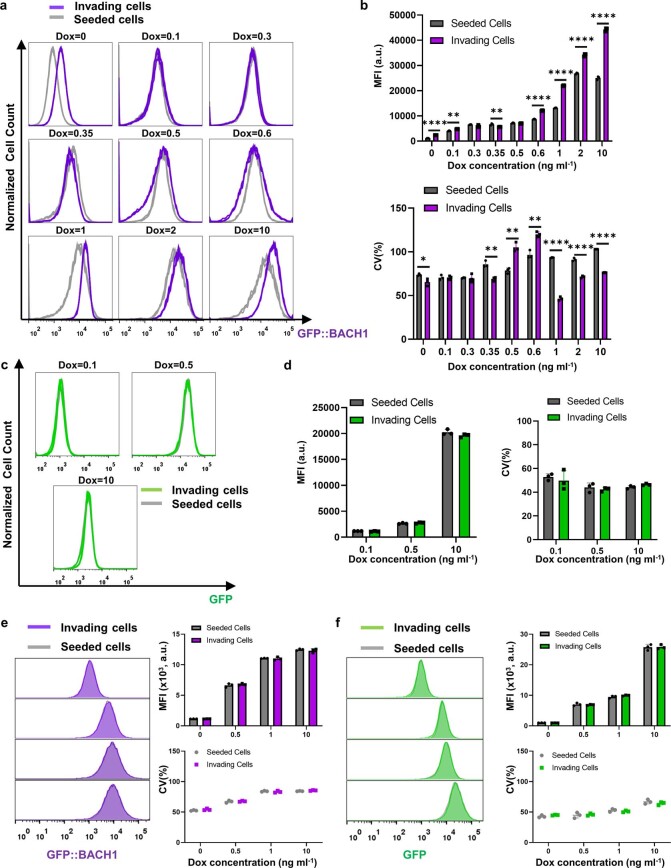
Extended Data Fig. 8. BACH1 expression profile shifts in high-noise clones and loss of BACH1 expression memory.
(a) Flow cytometry assessment of BACH1 expression profile changes in invading versus seeded cells at multiple points of the invasion landscape. These measurements are from the high-noise mNF-BACH1 MB231 clone, with three independent technical replicates. (b) Mean fluorescence intensity (top panel) and coefficient of variation (bottom panel) of invading versus seeded cells (unpaired two-tailed Student’s t-test, n = 3, *P < 0.05, **P < 0.01, ****P < 0.0001). (c) BACH1 expression profile-reshaping in invading cells versus seeded cells at three key Dox levels. These measurements are from the high-noise mNF-GFP MB231 clone with three independent technical replicates. (d) Mean fluorescence intensity (left panel) and coefficient of variation (right panel) for invading versus seeded cells (unpaired two-tailed t-test, n = 3, P > 0.05). (e)(f) Expression mean and noise measurements of the invading subpopulation of cells from low-noise mNF-BACH1 (e) and mNF-GFP (f) clones from the 10 ng ml−1 Dox invasion assay, which were allowed to recover in normal culture condition and were then reinduced. The data was compared to the seeded cell populations. Unpaired two-tailed t-test for each comparison, P > 0.05.

