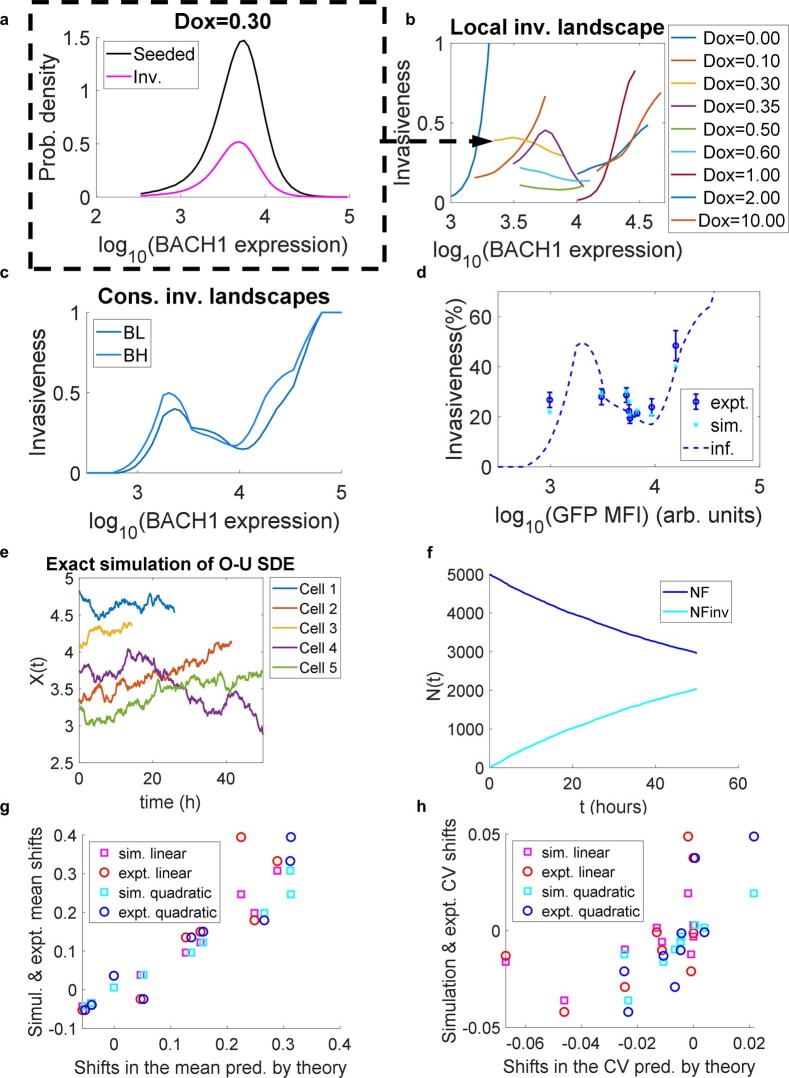
Extended Data Fig. 9. Theory and simulation of phenotypic selection by the nonmonotone invasion landscape.
(a) Histograms of seeded and invaded cells. Ratios of bin heights were used to estimate the local cellular fitness landscape for each Dox concentration. (b) Local cellular fitness landscapes estimated for each Dox concentration. (c) Global consensus cellular fitness landscapes for low-noise and high-noise cells, estimated as weighted averages of local fitness landscapes. (d) Simulated values of high-noise mNF invasiveness (cyan) compared to the experimental invasion landscape (blue - data, dashed blue line – consensus cellular invasion landscape). (e) Representative simulated Ornstein-Uhlenbeck (O-U) time courses of BACH1 levels in 5 single seeded cells. Some time courses terminate when seeded cells with higher BACH1 levels invade. (f) Simulated time courses of cell count above and below the membrane over 50 hours in invasion assays. (g) The shift of means for invading versus control seeded cells according to simulation and experiment, versus theory developed for linear and quadratic approximations of the fitness landscape, for low-noise mNF cells. (h) The shift of CVs for invading versus control seeded cells according to simulation, and experiment versus theory developed for linear and quadratic approximations of the fitness landscape, for low-noise mNF cells. Expt., experimental; Inf., inferred; Sim., simulated.

