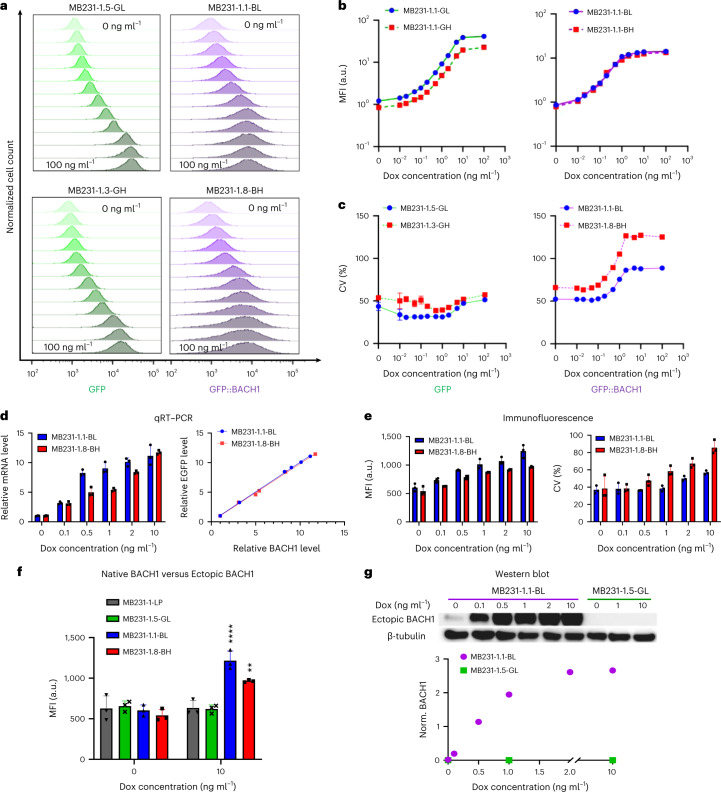
Fig. 2. Protein-level and transcript-level dose responses of the mNF-BACH1 gene circuit, site-specifically integrated into AAVS1 in MB231 cells.
a, Representative dose responses of fluorescence intensity histograms from low-noise mNF-GFP (GL), mNF-BACH1 (BL) and high-noise mNF-GFP (GH), mNF-BACH1 (BH) MB231 clones measured at 0, 0.01, 0.02, 0.05, 0.1, 0.2, 0.5, 1, 2, 5, 10 and 100 ng ml−1 dox levels, respectively. b, Dose responses of mean fluorescence intensity (MFI) for low-noise mNF-GFP (GL), mNF-BACH1 (BL) and high-noise mNF-GFP (GH), mNF-BACH1 (BH) MB231 clones (n = 3). c, Dose responses of CV for low-noise mNF-GFP (GL), mNF-BACH1 (BL) and high-noise mNF-GFP (GH), mNF-BACH1 (BH) MB231 clones (n = 3). d, Left: BACH1 mRNA level dose responses of both low-noise mNF-BACH1 (BL) and high-noise mNF-BACH1 (BH) MB231 clones. Relative mRNA levels were calculated between each individual replicate and the corresponding uninduced control (n = 3). Right: correlation between BACH1 and GFP mRNA levels in mNF-BACH1 clones (linear regression slopes of 0.9965 and 0.9778 for MB231-1.1-BL and MB231-1.8-BH, respectively; R2 goodness-of-fit values of 0.9992 and 0.9971 for MB231-1-BL and BH, respectively). e, Left: protein-level dose responses of total (endogenous + ectopic) BACH1 protein in both low-noise mNF-BACH1 (BL) and high-noise mNF-BACH1 (BH) MB231 clones (n = 3). Right: total BACH1 protein level noise assessed from immunofluorescence measurements for both low-noise mNF-BACH1 (BL) and high-noise mNF-BACH1 (BH) MB231 clones (n = 3). f, Comparison of total BACH1 protein level at uninduced (0 dox) and fully induced (10 ng ml−1 dox) conditions for low-noise mNF-BACH1 (BL) and high-noise mNF-BACH1 (BH) MB231 cell populations to native BACH1 protein level in low-noise mNF-GFP (GL) and their parental LP cell populations. n = 3, one-way ANOVA with Tukey’s multiple comparison correction at 0 dox and 10 µg ml−1 dox with respect to LP sample, **P < 0.01, ****P < 0.0001. g, Western blot examination and quantitation of ectopic BACH1 protein-level dose response in low-noise mNF-BACH1 and mNF-GFP MB231 samples. BACH1 levels were normalized to corresponding internal β-tubulin levels using grayscale quantitation.

