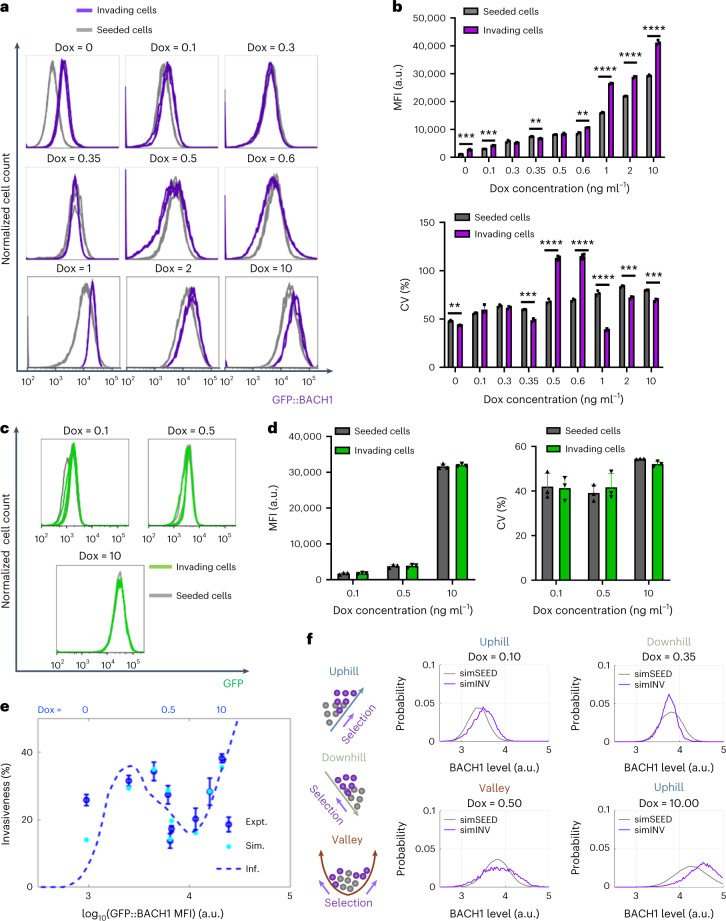
Fig. 4. BACH1 expression profile shifts of invading cells indicate directional and divergent selection.
a, Flow cytometry expression profile changes of invading low-noise BACH1 cells versus seeded cells at multiple points of the invasion landscape (n = 3). b, MFI (top) and CV (bottom) comparison between invading cells and seeded cells (unpaired two-tailed t-test, n = 3, **P < 0.01, ****P < 0.0001). c, Flow cytometry expression profile comparisons for invading low-noise mNF-GFP cells versus seeded cells at three key dox levels. d, MFI (left) and CV (right) of invading versus seeded cells (unpaired two-tailed t-test, n = 3, P > 0.05). e, Cellular invasion landscape (dashed blue line) of low-noise mNF-BACH1 (BL) clone versus log10(mean BACH1 expression) inferred from flow cytometry histograms of seeded and invading cells. Stochastic simulation results (cyan) for cells invading according to their BACH1 level dependent position on the landscape are compared to the experimental data (blue). f, Computationally predicted log10(BACH1 expression) profile changes in the invaded cell population at distinct landscape ranges due to directional (fitness slope uphill and downhill) and divergent (fitness valley) selection. Expt., experimental; Inf., inferred; Sim., simulated.

