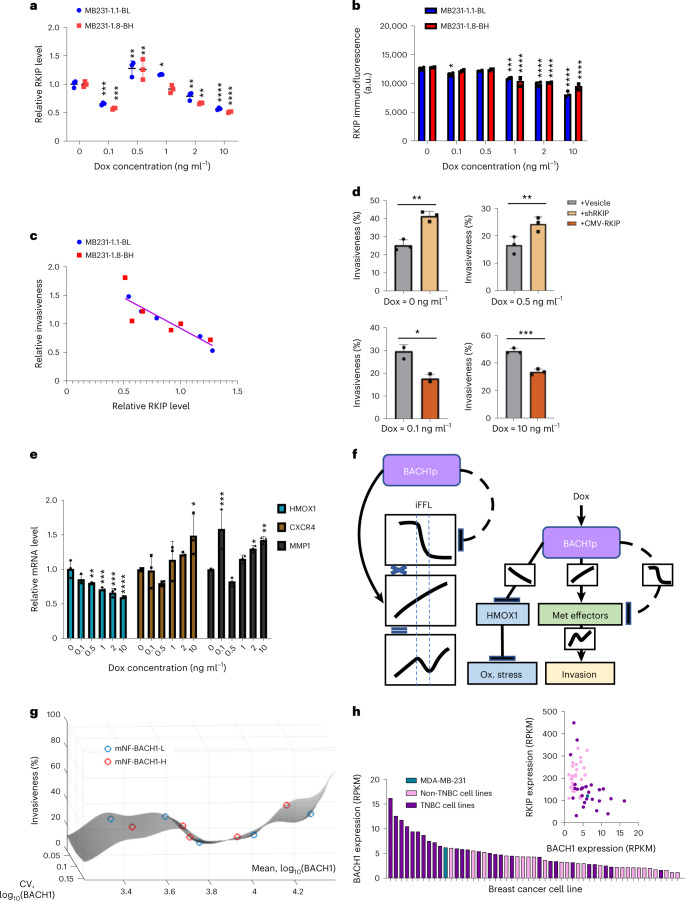
Fig. 6. Nonmonotone transcriptional regulations of metastasis-related targets from BACH1 consistent with nonmonotone invasion landscape.
a, RKIP mRNA level changes for increasing dox concentrations in both low-noise mNF-BACH1 (BL) and high-noise mNF-BACH1 (BH) MB231 clones with respect to the corresponding uninduced sample. n = 3, one-way ANOVA with Tukey’s multiple comparisons tests between each dose and uninduced controls, *P < 0.05, **P < 0.01, ***P < 0.001, ****P < 0.0001. b, Immunofluorescence quantitation of RKIP protein dose responses in both low-noise mNF-BACH1 (BL) and high-noise mNF-BACH1 (BH) MB231 clones with respect to the corresponding uninduced sample. n = 3, one-way ANOVA with Tukey’s multiple comparisons tests between each dose and uninduced controls, *P < 0.05, ***P < 0.001, ****P < 0.0001. c, Dose-responsive RKIP expression correlates negatively with nonmonotonic BACH1 invasion landscape, r = −0.8766, P = 0.0002. Samples were averaged with n = 3 technical replicates and normalized to the mean of corresponding uninduced sample, Pearson correlation. d, RKIP-dependent invasiveness changes at 0, 0.1, 0.5, 10 ng ml−1 dox concentrations. RKIP was overexpressed at 0.1 ng ml−1 and 10 ng ml−1 dox levels where it was significantly more suppressed, and RKIP was knocked down via shRNAmir at 0 and 0.5 ng ml−1 dox levels where it was much less suppressed. Two-tailed t-test between each experimental pair, n = 3, *P < 0.05, **P < 0.01, ***P < 0.001. e, HMOX1, MMP1 and CXCR4 mRNA level changes at increasing dox concentrations in low-noise mNF-BACH1 (BL) MB231 clones with respect to the corresponding uninduced sample. n = 3, one-way ANOVA with Dunnett’s multiple comparisons test between each dose and uninduced controls, *P < 0.05, **P < 0.01, ***P < 0.001, ****P < 0.0001. f, Regulatory network model that illustrates how iFFLs originating from BACH1 and converging on metastasis effectors such as CXCR4 and MMP1 can potentially underlie the nonmonotone invasion landscape and transcriptional regulation. Combining sharp and gradual response functions of opposite effects (activating and inhibitory) results in nonmonotone response functions. Solid lines indicate known regulatory pathways, whereas dashed lines indicate indirect, somewhat hypothetical pathways. Sigmoidal or gradual functions on the connections represent the characteristics of response curves for pairs of regulators. g, Invasion landscape interpolated based on invasiveness data points versus both mean and noise (CV) of log10 BACH1 expression, using biharmonic spline interpolation. h, Top: comparison between RNA levels of BACH1 and RKIP in TNBC (n = 28) cell lines and non-TNBC (n = 25) breast cancer cell lines. Bottom: BACH1 mRNA expression in major breast cancer cell lines classified into TNBC and non-TNBC categories. Met, metastasis, Ox., oxidative; RPKM, reads per kilobase of transcript per million mapped reads.

