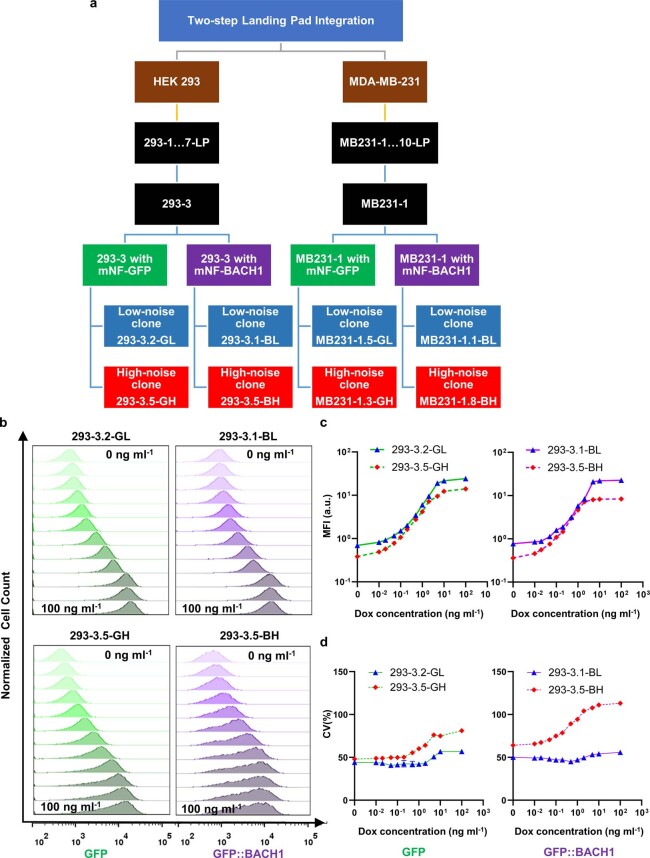
Extended Data Fig. 2. Cell line engineering scheme in MB231 and HEK293 cells, and flow cytometry quantitation of inducible expression in selected HEK293 clones.
(a) Cell line engineering steps and corresponding annotations for different sets of engineered cells, indicating the chosen parental LP clones and corresponding mNF clones. Low- and high-noise clones of both mNF-GFP and mNF-BACH1 clones were labelled GL, GH and BL, BH, respectively. (b) Representative dose-responses of fluorescence intensity histograms from low-noise mNF-GFP (GL), mNF-BACH1 (BL) and high-noise mNF-GFP (GH), mNF-BACH1 (BH) 293 clones measured at 0, 0.01, 0.02, 0.05, 0.1, 0.2, 0.5, 1, 2, 5, 10, 100 ng ml−1 Dox levels, respectively. (c) Dose-responses of mean fluorescence intensity (MFI) for low-noise mNF-GFP (GL), mNF-BACH1 (BL) and high-noise mNF-GFP (GH), mNF-BACH1 (BH) 293 clones (n = 3). (d) Dose-responses of coefficient of variation (CV) from low-noise mNF-GFP (GL), mNF-BACH1 (BL) and high-noise mNF-GFP (GH), mNF-BACH1 (BH) 293 clones (n = 3).

